A Wealth of (Managed Futures) Common Sense

If you haven’t had the chance to check out the work of Ben Carlson over on his blog, “A Wealth of Common Sense,” we highly suggest it. We’ve written about his thoughts and ideas a couple times (here and here) and we couldn’t help but notice the subject of his musings on doing what works for you in his latest post, “The Importance of Intellectual Honesty in the Markets” is of Managed Futures.

“Managed Futures is a trend following strategy that trades futures contracts both long and short depending on the direction of the markets. The strategies are typically diversified across stocks, bonds, interest rates, commodities and currencies and follow a systematic approach. Also called CTAs (commodity trading advisors), these funds got a ton of attention following the 2008 crash because they were one of the few places to earn positive returns when stock markets around the globe sold off anywhere between 35-55%.

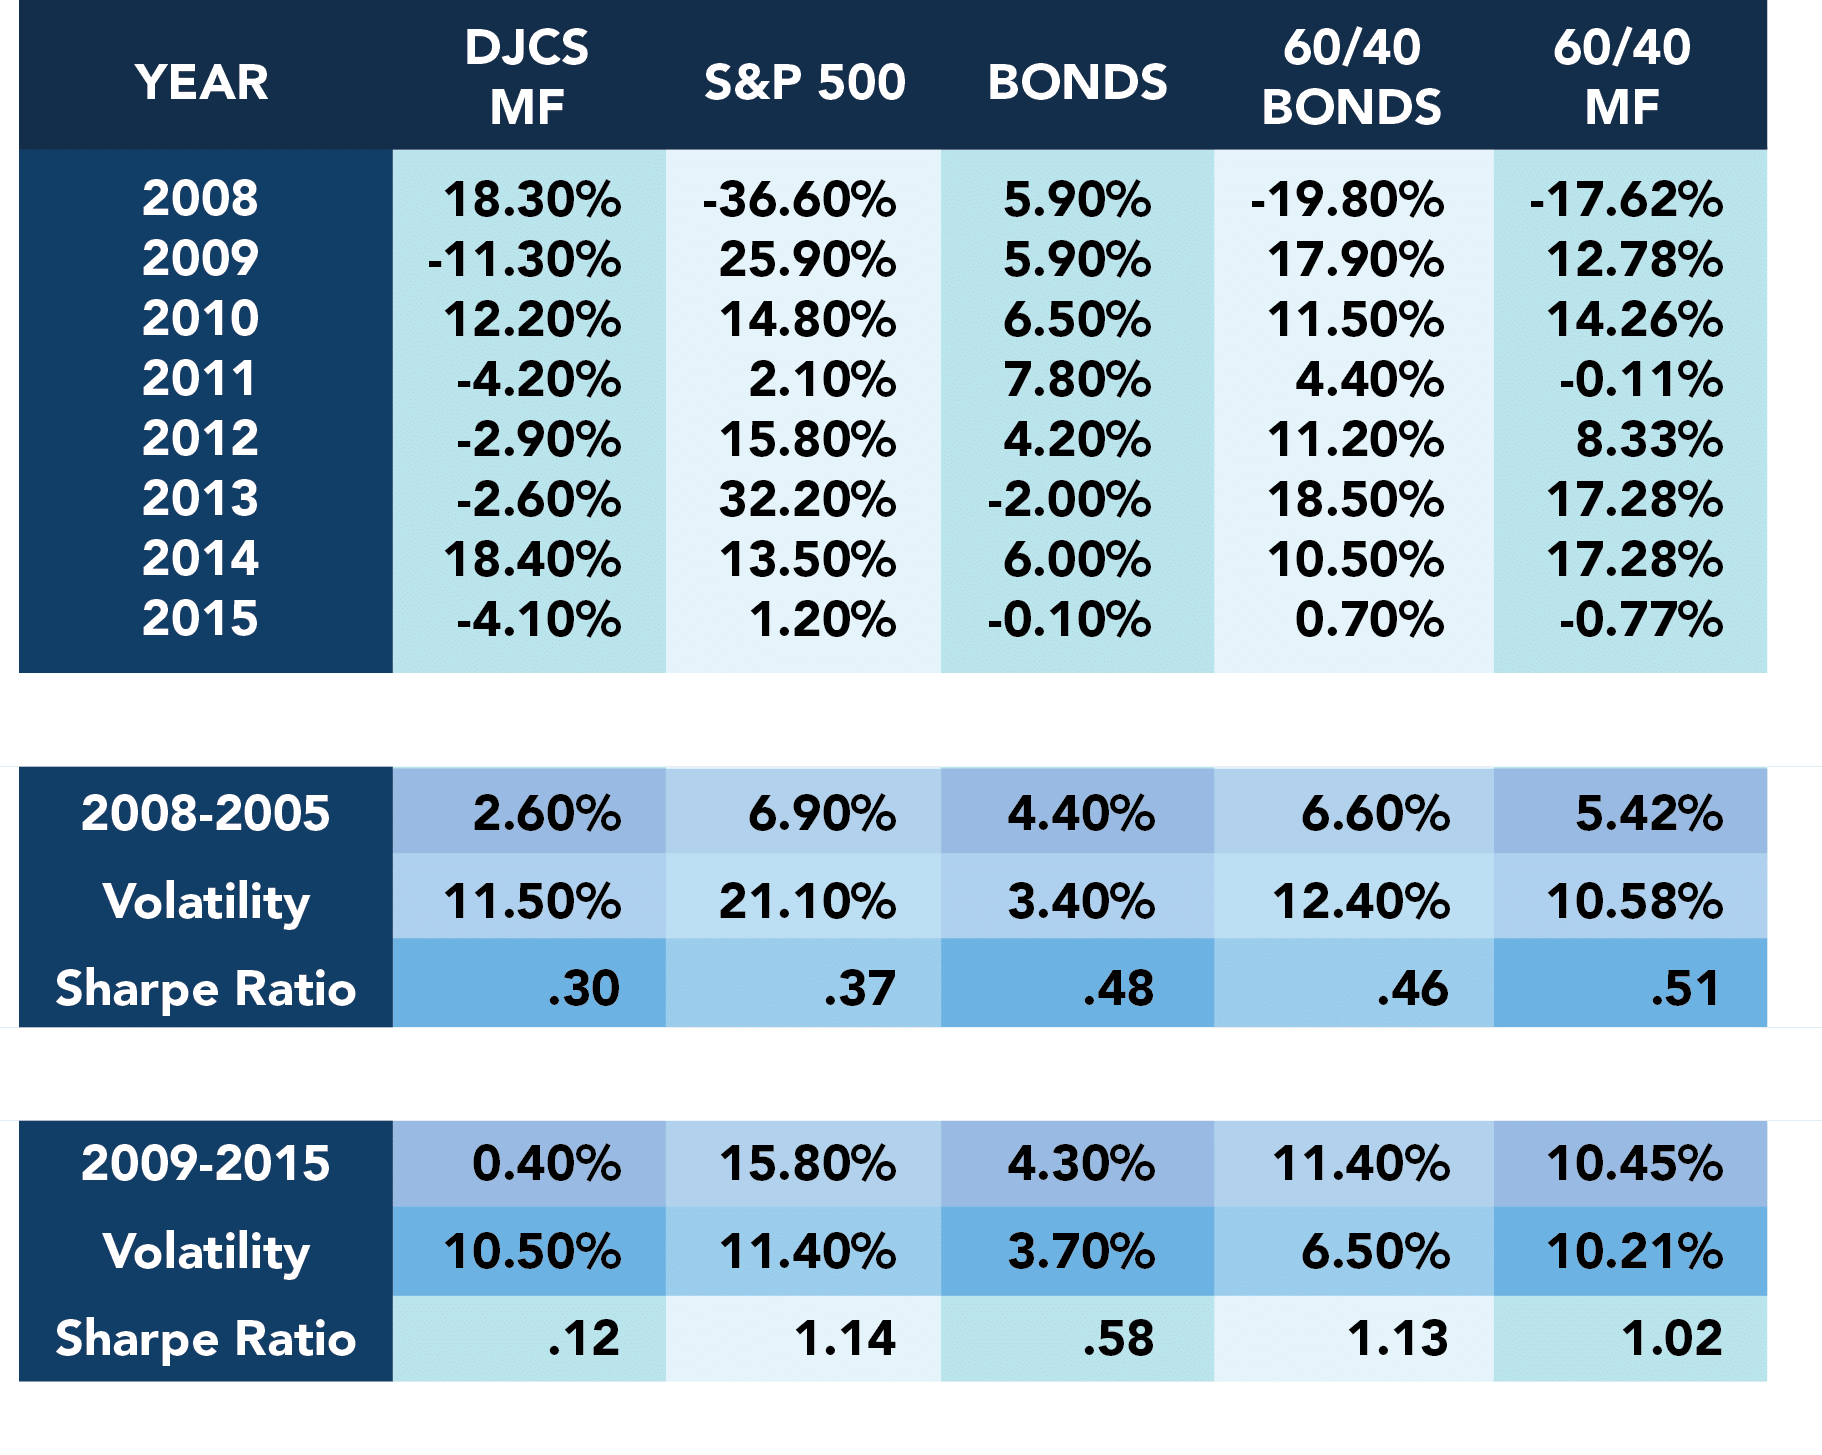
I looked at the Credit Suisse Managed Futures Index going back to 2008 and compared it to the annual returns on stocks, bonds and a 60/40 stock/bond portfolio through June of this year:

Asset Class Performance since 2008(Disclaimer: Past performance is not necessarily indicative of future results)
Chart Courtesy: A Wealth of Common Sense

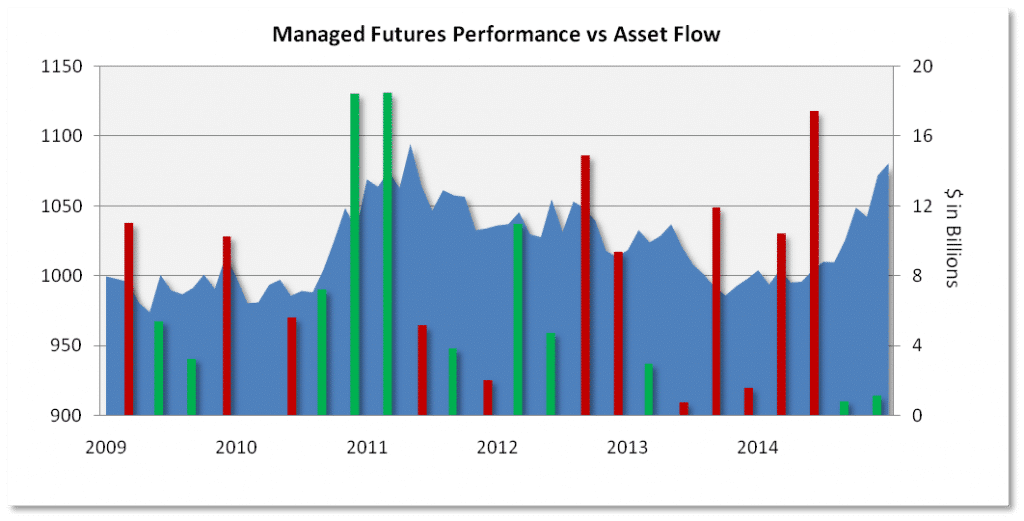
But it wasn’t just his feature of explaining the asset class of Managed Futures, it’s about how investors tend to chase performance, getting in at the highs and out at the lows. As Ben puts it:

“The biggest problem most investors face is that they invest in something like managed futures after they see the impressive results it had in 2008. Then they bail when it falters. Or they change their strategy to a low cost indexed buy and hold approach after seeing how well it’s done since 2009. Once again, many will bail during the inevitable down period.”

Which fits quite nicely with our “In at the Highs out at the Lows” Managed Futures chart.

Managed-Futures-Performance-vs-asset-flow-1024x521(Disclaimer: Past performance is not necessarily indicative of future results)
Chart Courtesy: In at the Highs, Out at the Lows 

Back to Ben Carlson:

“Despite these numbers, I don’t think it makes sense to completely write off (or pile into) a strategy simply because it’s had a poor (or good) run over the past cycle. This is just one fairly short time frame. I’m all about intellectual honesty when discussing the markets. I don’t believe in disparaging someone else’s strategy just because I don’t invest that way. My motto has always been, ‘do what works for you, as long as it helps you reach your goals and allows you to sleep at night.”

We couldn’t have said it better ourselves, but since we’re in the Managed Futures space, we can’t help but take it a step further. We want to add one of Ben’s sentences.

“It’s worth noting that the Credit Suisse index isn’t representative of all trend following strategies, but it does give you an idea about the struggles the space has endured following the crash.”

The fact that the index isn’t representative of all trend following strategies is definitely worth noting, and shows Mr. Carlson is no newcomer to this game. But here’s where things get even a little more interesting. Because not only is the index not representative of all trend following- but trend following is not representative of all Managed Futures. As we talk about in our Managed Futures strategy review every year, there’s also Short Term, Multi-Strategy, Specialty, Agriculture, Spread, and Options strategies.  Not to mention the managed futures-like Global Macro programs. Which is why those who find managed futures ‘works for them’, in Ben’s parlance; may not have found it to be as much of a struggle as the chart suggests.

For instance, in 2013, the Barclayhedge Agricultural Traders sub index was up 5.71%, when the Credit Suisse index was down -2.6%. In 2011, The Barclayhedge Discretionary Traders Index was up +2.75%, while Credit Suisse was down -4.2%. In 2012, the Attain Short Term Fund was up 10.29%% while the Credit Suisse was down -2.9%. {Disclaimer: Past performance is not necessarily indicative of future results}. Of course, you would need a crystal ball to know which of those sub strategies was going to perform each year and which weren’t; but you get the point. Just like small cap stocks can diverge from large cap, or Asian stocks be up while US stocks down; different types of managed futures strategies can, and will (and have), diverge from the poster child trend following strategy. That’s why our Philosophy is to surround a core allocation to trend following with these other strategies to ‘diversify the diversifier’.

How about a Longer View:

Which brings us to a tweet asking for a little more data – something we’re happy to dive into.


Here’s what a 60/40 portfolio looks like using Carlson’s same table, with the Sharpe ratio added in to compare the different return and volatility levels (although you know we’re not huge fans of the Sharpe):

Asset Class Ratio Addition of Managed Futures
(Disclaimer: Past performance is not necessarily indicative of future results)
Data = (60/30 MF) is 60% SPY & 40% DJCS Managed Futures Index
Other data from: A Wealth of Common Sense

But as Mr. Carlson said, this is a “fairly short time frame.” What does it look like if we push it out back to the inception of the Credit Suisse index?  And while we’re at it, we’ll be the first to tell you managed futures isn’t meant to replace bonds (although that might not be a terrible idea in a rising rate environment). So what does it look like when diversified into managed futures and Bonds with an allocation of (45% Stocks / 28% Bonds / 30% Managed Futures)? Here you go:

Ratio Two 1994-2015
(Disclaimer: Past performance is not necessarily indicative of future results)
Data: DJCS Managed Futures Index
S&P 500 = SPY Bonds = Barclays Global Aggregate Bond Index

You can see argument for a managed futures allocation in these longer term stats, which speaks directly to Carlson’s main point:

“I don’t think it makes sense to completely write off (or pile into) a strategy simply because it’s had a poor (or good) run over the past cycle.”

For more information on Managed Futures Performance, check out our Whitepaper highlighting the “Performance Profile: Managed Futures

One comment

  1. […] On the use of managed futures as a portfolio diversifier. (managed-futures-blog.attaincapital) […]

Write a Comment

Disclaimer
The performance data displayed herein is compiled from various sources, including BarclayHedge, and reports directly from the advisors. These performance figures should not be relied on independent of the individual advisor's disclosure document, which has important information regarding the method of calculation used, whether or not the performance includes proprietary results, and other important footnotes on the advisor's track record.

The programs listed here are a sub-set of the full list of programs able to be accessed by subscribing to the database and reflect programs we currently work with and/or are more familiar with.

Benchmark index performance is for the constituents of that index only, and does not represent the entire universe of possible investments within that asset class. And further, that there can be limitations and biases to indices such as survivorship, self reporting, and instant history. Individuals cannot invest in the index itself, and actual rates of return may be significantly different and more volatile than those of the index.

Managed futures accounts can subject to substantial charges for management and advisory fees. The numbers within this website include all such fees, but it may be necessary for those accounts that are subject to these charges to make substantial trading profits in the future to avoid depletion or exhaustion of their assets.

Investors interested in investing with a managed futures program (excepting those programs which are offered exclusively to qualified eligible persons as that term is defined by CFTC regulation 4.7) will be required to receive and sign off on a disclosure document in compliance with certain CFT rules The disclosure documents contains a complete description of the principal risk factors and each fee to be charged to your account by the CTA, as well as the composite performance of accounts under the CTA's management over at least the most recent five years. Investor interested in investing in any of the programs on this website are urged to carefully read these disclosure documents, including, but not limited to the performance information, before investing in any such programs.

Those investors who are qualified eligible persons as that term is defined by CFTC regulation 4.7 and interested in investing in a program exempt from having to provide a disclosure document and considered by the regulations to be sophisticated enough to understand the risks and be able to interpret the accuracy and completeness of any performance information on their own.

RCM receives a portion of the commodity brokerage commissions you pay in connection with your futures trading and/or a portion of the interest income (if any) earned on an account's assets. The listed manager may also pay RCM a portion of the fees they receive from accounts introduced to them by RCM.

Limitations on RCM Quintile + Star Rankings

The Quintile Rankings and RCM Star Rankings shown here are provided for informational purposes only. RCM does not guarantee the accuracy, timeliness or completeness of this information. The ranking methodology is proprietary and the results have not been audited or verified by an independent third party. Some CTAs may employ trading programs or strategies that are riskier than others. CTAs may manage customer accounts differently than their model results shown or make different trades in actual customer accounts versus their own accounts. Different CTAs are subject to different market conditions and risks that can significantly impact actual results. RCM and its affiliates receive compensation from some of the rated CTAs. Investors should perform their own due diligence before investing with any CTA. This ranking information should not be the sole basis for any investment decision.

See the full terms of use and risk disclaimer here.

logo