
The world of investors and investment managers just can’t seem to stop staring at the VIX, VIX futures, and the billions in VIX-related products out there these days. You’ll be hard pressed to follow anyone of significance in the financial space on twitter without getting a heavy dose of VIX-related news and notes (usually along the lines of a comment on how someone can’t believe it is going lower once again or it’s set some new multi-year record for low-ness).
Today has a shot at being the first #VIX close beneath 10 in more than 10 years (Jan 24, 2007).
— Ryan Detrick, CMT (@RyanDetrick) May 8, 2017
Many will attribute the recent down move to the collective sigh of relief when pro-EU French candidate Macron won the French presidential election, against a populist anti-EU candidate, Le Pen, who may have set about Frexit. But does the explanation really fit? It seems to us this is just what the VIX does (go lower), and the financial blogosphere just comes up with stuff trying to explain that phenomenon time and again. Case and point, here’s the VIX from just before Brexit through the present.
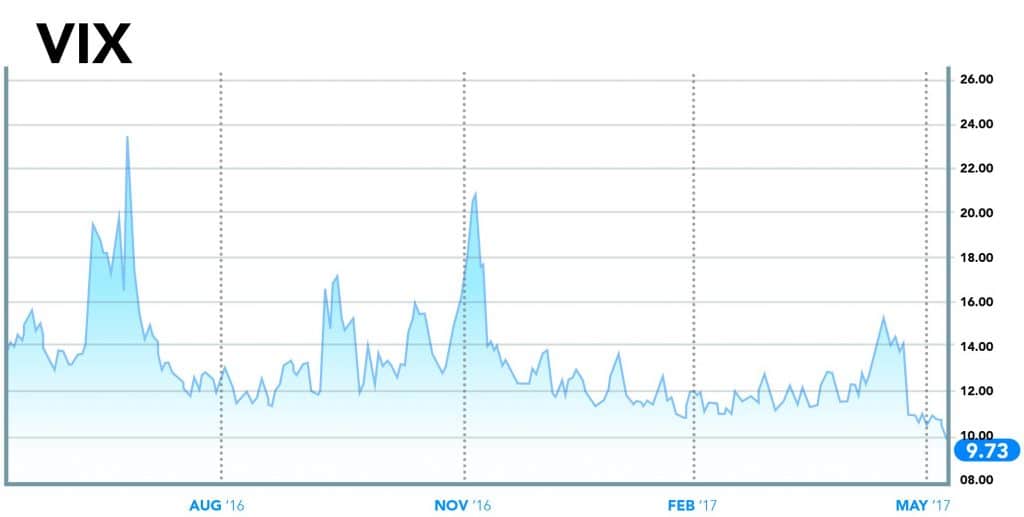 (Disclaimer: Past performance is not necessarily indicative of future results)
But despite being known as the “fear gauge,” the VIX index has done very little to cause or reflect fear these days. What it’s best known for these days is a consistent reversion to the mean trade. Or said another way, as a wealth transfer mechanism between the cautious/fearful and the observant/risk acceptors. There’s now around $4 Billion “invested” (we’ll use that term lightly) in VIX ETPs and ETFs, with the split of those assets breaking down as follows per Goldman Sachs via ZeroHedge:

(Disclaimer: Past performance is not necessarily indicative of future results)
That’s about $2 Billion (56% of assets) who are ‘long volatility’ according to these stats, and $1.3 Billion (36%) who are “short volatility, ” with the bulk of that being on the short end of the curve (1 month or less). That’s a lot of money trying to guess which way volatility will go over the very short term, for what has been a pretty one-sided trade over the past 8 years. Goldman estimates that the “short vol” side has been the big winner in this trade, having produced massive returns via a pretty straightforward and simple trade.
The S&P 500 VIX Short-Term Futures Daily Inverse Index which tracks the return of being short a one-month VIX future was up 4364% from March 9, 2009 through 1Q 2017. The index has had a median daily return of 0.6% and an annualized return of 21.5% since December 2005.
(Disclaimer: Past performance is not necessarily indicative of future results)

Now, Goldman’s not the only people who have seen this trade as a pretty good thing of late, the rest of us can see it every time we check out the VIX chart or peer at VIX futures – where the pattern is down, down, down, up a bit, then down, down, down, up a bit, and rinse and repeat as needed. That has led, in no small way, to a gold rush of sorts in the private and public fund space with investment managers flooding into VIX futures to capture some of this structural alpha, as some call it. We covered that a bit in a CTA intelligence article, and here’s the proof in the pudding – the chart that keeps the folks at the CBOE smiling from ear to ear when they lay their option filled heads on their pillows at night, showing one of the best futures contracts success stories since the e-mini S&P.

(Disclaimer: Past performance is not necessarily indicative of future results)
Of course, it’s never that easy, and it turns out the VIX-focused ETFs, whether they be long or short, and even VIX futures – aren’t for the uninitiated. One recent Barron’s article puts it bluntly:
Can you trade the fear gauge that everyone quotes? If you answered yes, study the VIX and come back next year. If you know the fear gauge is a tracking index, onward to the next level. How are VIX options priced? If you answered VIX futures, you know more about the VIX than most. Still, if you cannot see the VIX futures curve in your head, burning $100 bills is probably more profitable than trading them.
Barron’s isn’t wrong; it’s not just about understanding the price curve but understanding the return drivers behind these ETPs. For example, while shorting volatility via VIX futures has been very profitable, it’s never a mirror of long volatility strategies. Here’s Goldman via Zerohedge again: Most VIX ETPs are rebalanced daily, which means they track the one-day return of an index.
Most VIX ETPs are rebalanced daily, which means they track the one-day return of an index. By construction, that means that a long and a short can track their respective benchmarks perfectly each day but they may not be mirror images of each other over longer holding periods due to the compounding of returns. August of 2015 was an interesting example in a tough market. The benchmark for a one-month VIX futures strategy was up 71%, the inverse was down [only] 48% and the double-levered was up 170%.

(Disclaimer: Past performance is not necessarily indicative of future results)
Conclusion
Bloomberg estimates that 18% of the $4 Billion has come into VIX ETPs this year alone. Anytime you have this much money pouring into a rather new sector, people question whether the products are affecting the markets themselves. It’s a topic Matt Thompson of Typhon Capital (a professional trader of VIX Futures and Options) discussed in our recent webinar.
“Matt Thompson: Over the past couple of years – The VIX Futures market has matured to a two-way market. I think you see far more participants on the short side of the volatility trade. $XIV is a very popular exchange-traded note, that is a pure example of a short vol trade. I think that you see that manifest itself in the spikes that we had – whether it was Brexit or the election. Volatility now can spike down – as much as it can spike up. In the past, volatility has taken multiple weeks to come off spikes up. Now, you’re seeing just as fast down moves as you see the up moves. I think the danger of this is it could create instability if the boat gets too loaded on one side of the trade. I think the true test of managers will be when we go through the next sustained period of high volatility, where the VIX is over a sustained period of backwardation – when they short trade stops being such a layup.
Bloomberg echoed some of these comments in a recent piece talking about when trades get too crowded. Here’s Bloomberg:
When trades are especially crowded, their unwinding can amplify market moves as investors seek to de-risk in unison. Stable markets not only invite trades that bet on the continuation of stability, they almost force investors to pursue them in an investment climate so deprived of nominal return.
The hurricane is not more or less likely to hit because more hurricane insurance has been written. In the financial markets, this is not true. The more people write financial insurance, the more likely it is that a disaster will happen because the people who know you have sold the insurance can make it happen. So you have to monitor what other people are doing.
The $4 Billion dollar questions are how crowded can this short volatility trade get before the dam breaks? And will it amplify any such breaking? We also wonder if there is a never ending supply of long volatility dupes, or if they will eventually wake up to the issue of giving up the 4,300% outlined by Goldman in their research? And at what point does the insurance become too costly to deploy day after day after day? We’ve long been in an environment where demand outweighed supply for long vol protection and may be entering a new phase where those who want to sell insurance outnumber those who want to buy it – causing an oversupplied market, where buyers require cheaper and cheaper prices in order to be enticed to buy. What would that look like in the VIX? It would look exactly like we have right now, with record low pricing on volatility. To twist the popular phrase… seller beware.
 hbspt.cta.load(313774, ‘d0c0de33-2d2a-4878-8403-47ce97c74196’, {});