25 Billion Global Futures Trades

The FIA (Futures Industry Association) is out with their annual data showing just how big the futures and options (what we some might call derivatives) world is. Specifically, looking at the 2017 volume and open interest on all futures and options exchanges. 2017 held steady with 25 Billion contracts:

2017 Futures Options Volume

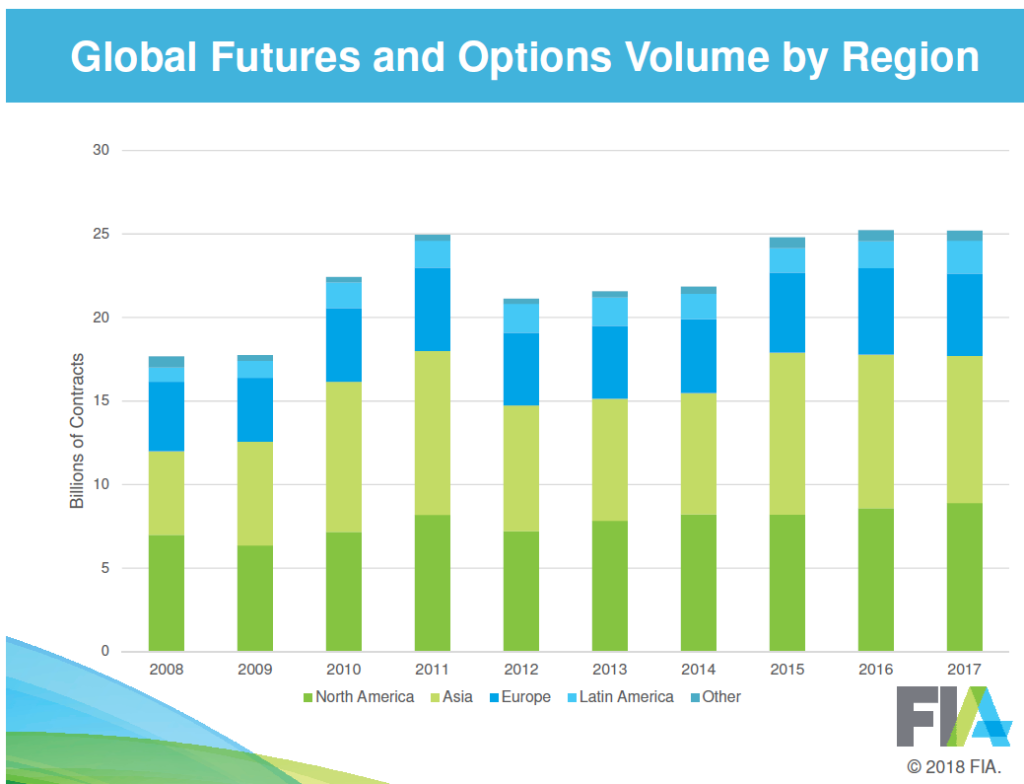
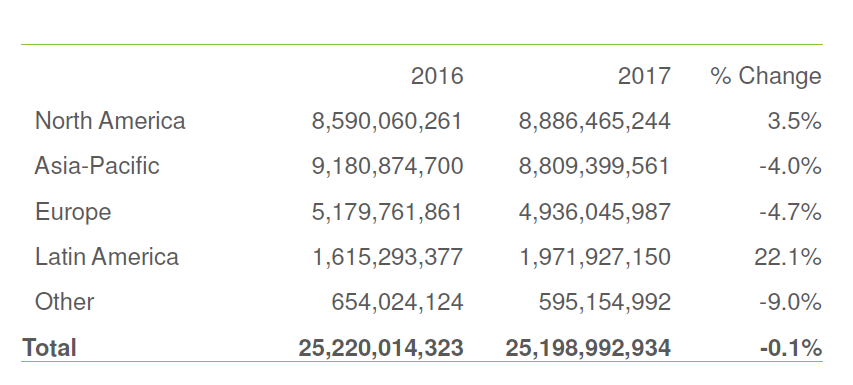
Overall volume did decline by 20 million trades, or 0.01% of total trades year-over-year. Each region experienced a decline in trading except North America and Latin America:

Futures Options Volume by Region

Growth by Sector

Between 2016 and 2017, volume of Interest Rate Futures and Options grew by 500 Million contracts. The biggest chance came from the 3 Month Euribor Futures contract (traded on the ICE Futures Europe) with volume up 62 Million trades, or a 46% increase. Eurodollar Mid-Curve Options saw a 35% increase in volume year-over-year, but comes in third place amongst most traded Interest Rate derivatives.

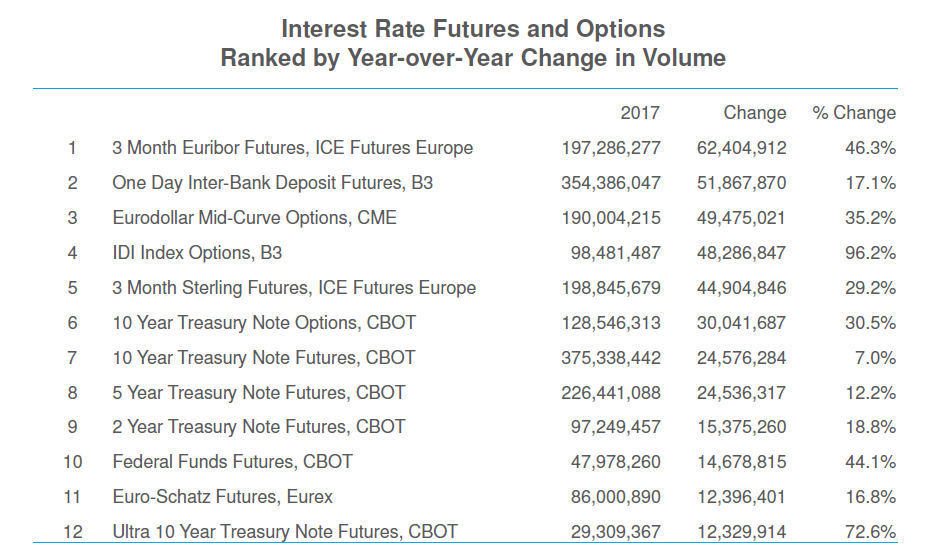
Meanwhile, the top Interest rate increase of open interest came from IDI Index Options, up 13 million contracts, or a 110% increase.

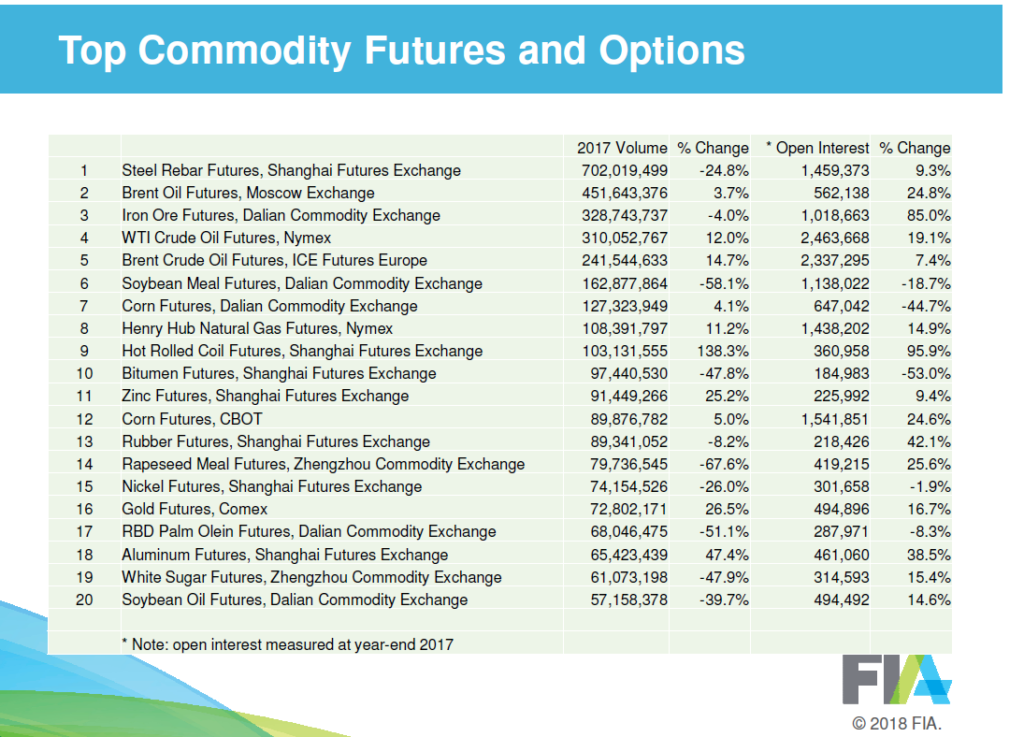
Top 20 Commodity Future Contracts Traded in 2017

Interest Rate Futures and Options might have been the highest performing sector, but what about the most traded Commodity future? If you would have guessed Steel Rebar Futures, you would have guessed right, followed by Brent futures traded on the Moscow Exchange.

Top commodity Futures and Options Volume 2017

Top Exchange

Finally, which futures exchange can hold claim to the most contracts handed over in the year 2017? No surprise, it is once again the CME with a 1.6 Billion in volume over second place, National Stock Exchange of India, and an almost 2 Billion contract lead over ICE:

Top Futures and Options Exchange 2017

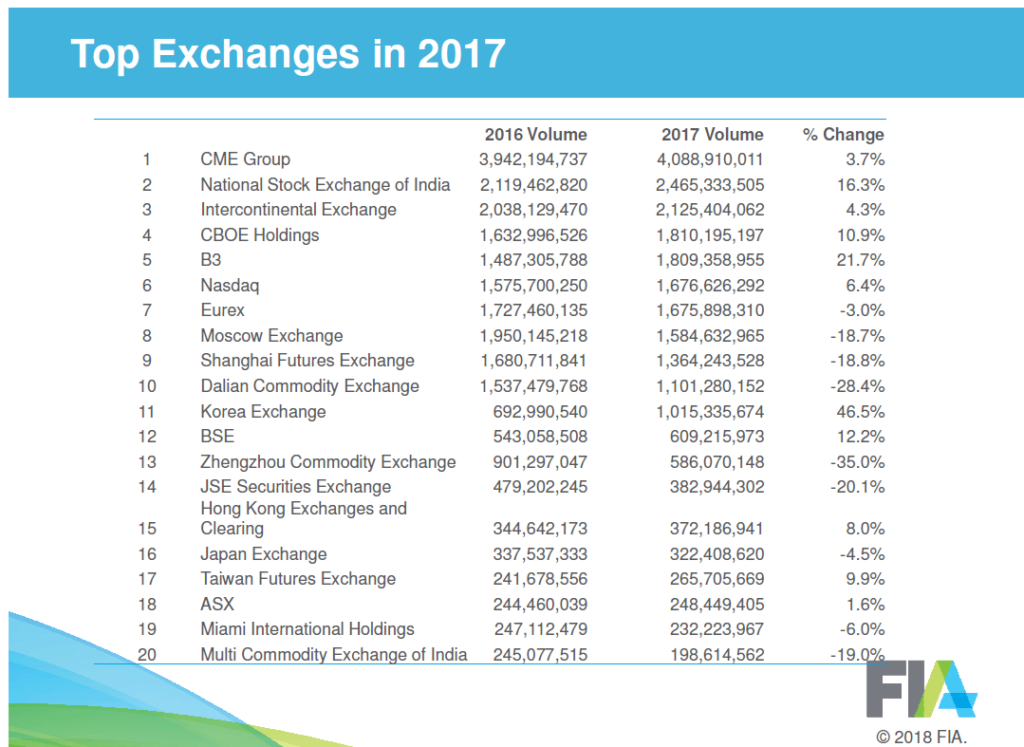
To put this into context, CME only led ICE by 300 Million contracts back in 2013. It’s not only that the CME has 1 Billion more contracts since 2013, but ICE has lost 700 Million contracts on its exchange since 2013.

Takeaway

In a year with little market movement, it’s good to see the amount of market activity remained the same. The CME has taken an even larger lead for volume than any other exchange. When it comes to interest rates, we will say that Managed Futures and Global Macro programs love interest rate markets, which would set up for an even more interesting 2018 than we’ve already experienced.

Disclaimer
The performance data displayed herein is compiled from various sources, including BarclayHedge, and reports directly from the advisors. These performance figures should not be relied on independent of the individual advisor's disclosure document, which has important information regarding the method of calculation used, whether or not the performance includes proprietary results, and other important footnotes on the advisor's track record.

The programs listed here are a sub-set of the full list of programs able to be accessed by subscribing to the database and reflect programs we currently work with and/or are more familiar with.

Benchmark index performance is for the constituents of that index only, and does not represent the entire universe of possible investments within that asset class. And further, that there can be limitations and biases to indices such as survivorship, self reporting, and instant history. Individuals cannot invest in the index itself, and actual rates of return may be significantly different and more volatile than those of the index.

Managed futures accounts can subject to substantial charges for management and advisory fees. The numbers within this website include all such fees, but it may be necessary for those accounts that are subject to these charges to make substantial trading profits in the future to avoid depletion or exhaustion of their assets.

Investors interested in investing with a managed futures program (excepting those programs which are offered exclusively to qualified eligible persons as that term is defined by CFTC regulation 4.7) will be required to receive and sign off on a disclosure document in compliance with certain CFT rules The disclosure documents contains a complete description of the principal risk factors and each fee to be charged to your account by the CTA, as well as the composite performance of accounts under the CTA's management over at least the most recent five years. Investor interested in investing in any of the programs on this website are urged to carefully read these disclosure documents, including, but not limited to the performance information, before investing in any such programs.

Those investors who are qualified eligible persons as that term is defined by CFTC regulation 4.7 and interested in investing in a program exempt from having to provide a disclosure document and considered by the regulations to be sophisticated enough to understand the risks and be able to interpret the accuracy and completeness of any performance information on their own.

RCM receives a portion of the commodity brokerage commissions you pay in connection with your futures trading and/or a portion of the interest income (if any) earned on an account's assets. The listed manager may also pay RCM a portion of the fees they receive from accounts introduced to them by RCM.

Limitations on RCM Quintile + Star Rankings

The Quintile Rankings and RCM Star Rankings shown here are provided for informational purposes only. RCM does not guarantee the accuracy, timeliness or completeness of this information. The ranking methodology is proprietary and the results have not been audited or verified by an independent third party. Some CTAs may employ trading programs or strategies that are riskier than others. CTAs may manage customer accounts differently than their model results shown or make different trades in actual customer accounts versus their own accounts. Different CTAs are subject to different market conditions and risks that can significantly impact actual results. RCM and its affiliates receive compensation from some of the rated CTAs. Investors should perform their own due diligence before investing with any CTA. This ranking information should not be the sole basis for any investment decision.

See the full terms of use and risk disclaimer here.

logo