
As Ferris Bueller famously said, “Life moves pretty fast. If you don’t stop and look around once in a while, you could miss it.”
In that spirit, we thought we’d take a minute and look around at this impressive stock market we’re in. The stock market has been absolutely roaring. The S&P 500 is up about 30% this year (+28.07% through December 9th), and has surged more than 75% since the depths of September 2022. How does this spectacular run stack up historically?
Breaking Down the Numbers
Let’s put this year in perspective, knowing full well the year isn’t over yet. Hopefully we don’t jinx it over the next few weeks ?! 2024’s performance ranks as the:
- 9th best annual return in the past 35 years
- 3rd best annual return in the past decade
Here’s those best 10 return years for the S&P total return index since 1990 (35 years), along with the year it happened, and the returns for the following three years, with an average of the following three years:
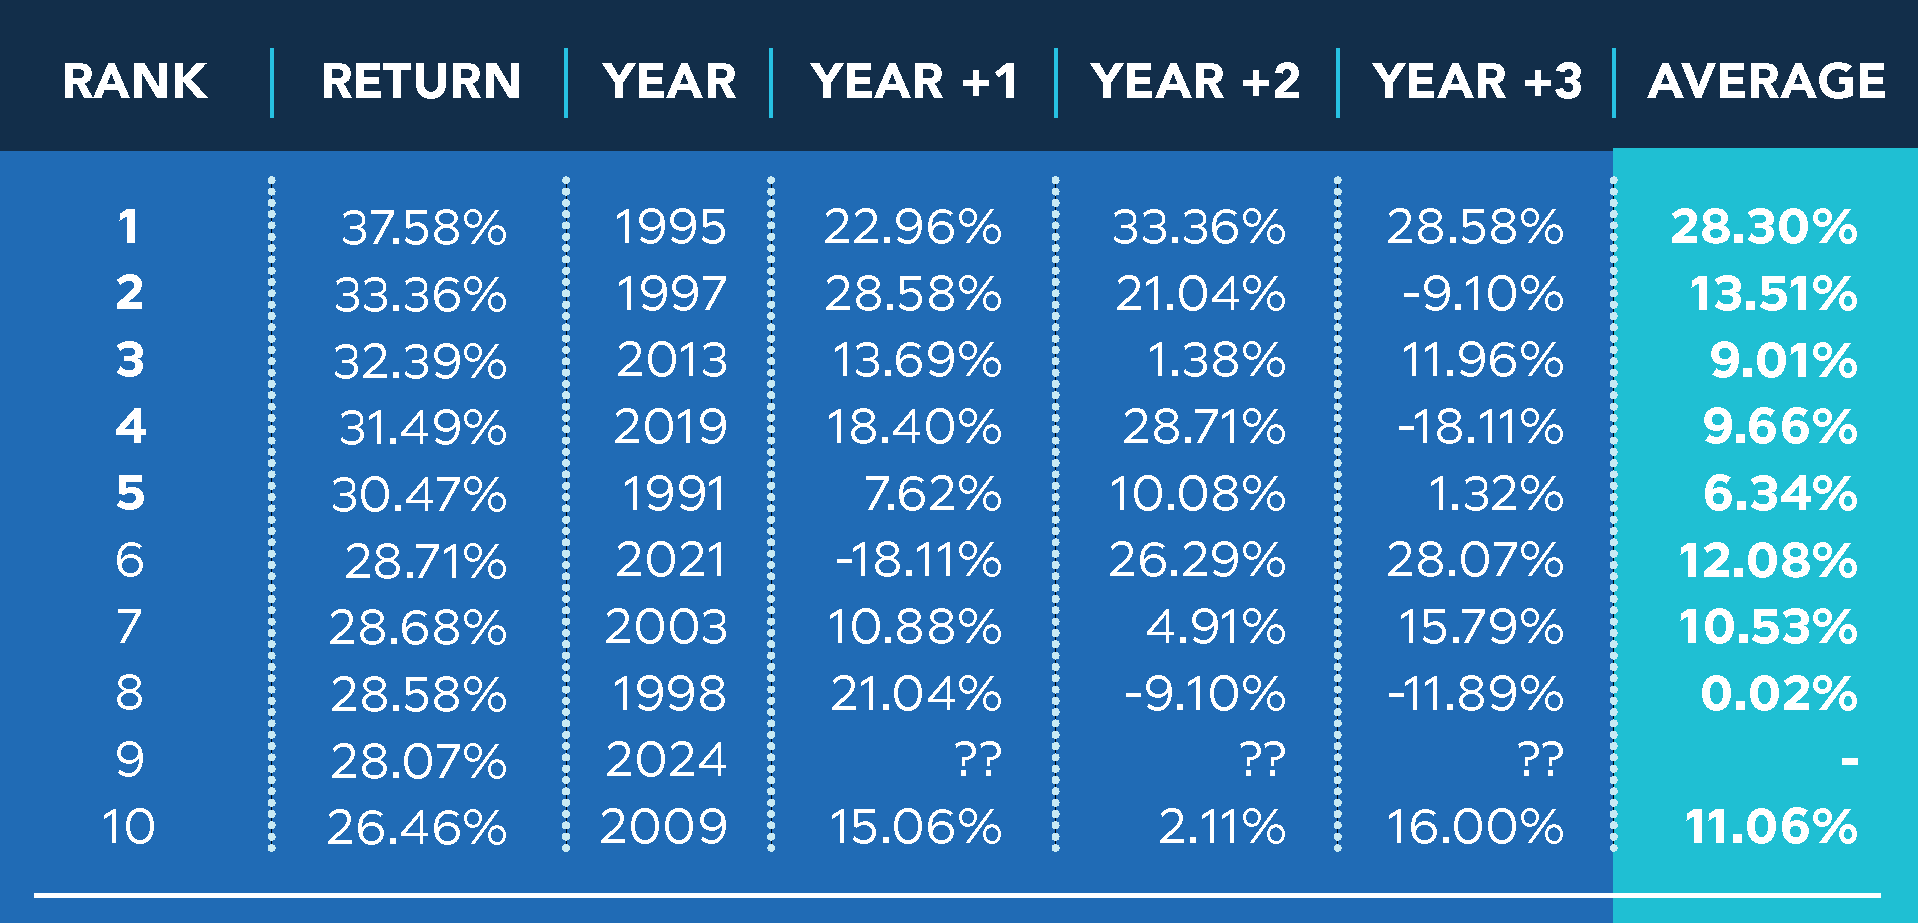
Past performance is not indicative of future results.
What typically Happens After a Banner Year?
This is a bit of a mixed bag. On the one hand, all but one year (2021) had a positive return in the following year. On the other hand, history suggests we should temper our expectations a bit for 2025. While returns following these exceptional years have generally remained positive, they’ve consistently been more modest than their predecessor years.
The 75% Surge Since late 2022:
How about the current 75.70% gain over the past 27 months (since October 2022). We know… that’s a weird rolling period, but it’s the end of the year as we’re looking at this, and it’s been 27 months, so what do you want us to do? Anyway, back to this move. It’s high, to be sure, but as can be seen below – the S&P was hanging out even higher than this for most of the 97 to 99 period (also known as the dot-com bubble). It then infamously didn’t post any such periods for nearly 10 years following that bubble, what some call the lost decade. Is the AI bubble creating a similarly forthy environment? Who knows. We sure seem like we’re up towards the top of the band in the chart below. But timing these things is difficult, to say the least.
No, we’d rather participate, but hedge against the inevitable rainy day. That could mean carving off a piece of the portfolio and investing in managed futures *(give us a call), or checking out some of the newer funds and ETFs pairing equities and Alts in a single investment:
2024 YTD performance thru Dec 17th
| YTD RETURN | TICKER | NAME |
|---|---|---|
| 22.3% | RSST | Return Stacked US Stocks & Mgd Futs ETF |
| 18.9% | HDCTX | Rational Equity Armor Fund Instl |
| 18.8%^ | Mutiny LVS | Mutiny Funds Long Vol+Stocks |
| 16.3% | BLNDX | Standpoint Multi-Asset Institutional |
| 11.4% | HMXIX | Alpha Centric Premium Opportunity 1 |
The run off the covid lows put us back up there pretty well, before the loss in 2022 and now this rally. So, it’s high but not necessarily rare, is impressive but not unprecedented. During the dot-com era of 1997-1999, the S&P 500 actually maintained even higher rolling 27-month returns. Of course, we all remember what followed – the notorious “lost decade” where such dramatic gains became a distant memory.
We saw similar impressive numbers during the recovery from the COVID-19 lows, before 2022’s downturn and the current rally.
The Bottom Line
While we’re certainly experiencing an exceptional bull market, it’s not entirely unprecedented. The current run is impressive by historical standards but falls within patterns we’ve seen before. As always in markets, past performance doesn’t guarantee future results, but understanding the historical context helps put our current market environment in perspective.