
Gross or Net, Winton, and 5 vs 29

We got a comment the other day from an investor who reads our newsletters, touching on the fees involved with managed futures – something we covered in depth last year after Bloomberg Magazine trotted out a misinformed piece on ‘Futures Fund Fees’ (see our response here) – but we hadn’t seen the question of fees posed quite like this before:

“You wrote an article a while back addressing the critiques of Managed Futures Indices.  One area you didn’t address in those articles is the fact that performance numbers are reported gross of fees to those indices.  One of the biggest knocks on this space are the high fees involved, so this almost makes the indices useless, one could argue.”

This investor is somehow under the impression that the various managed futures indices are comprised of manager performance numbers gross of fees (that is, not including the usual 2% annual management and 20% of new profits incentive fee), wherever could he have gotten that idea Bloomberg.

To set the record straight – the main managed futures indices are calculated from manager level performance reported NET of fees. Here’s the language from both Newedge and DJCS:

Newedge Language:

“The index calculates the net daily rate of return for a pool of CTAs selected from the largest managers open to new investment.”

DJCS Language:

 “Does the Credit Suisse Hedge Fund Index use net or gross data?

Performance data used in the index is net of all fees. “

We’ll even take it a step further and tell you that NFA and CFTC regulations require managed futures managers registered as CTAs and CPOs to report their performance NET of fees, and that the overwhelming majority of managed futures programs which report to the indices are of a size where they use a third party accounting firm or ‘administrator’ to calculate their monthly performance numbers, insuring the correct deduction for accrued fees, any additions and withdrawals, and so on. It’s actually quite hard for a manager to ‘back out’ the fees and arrive at a gross performance number.

Now… what isn’t included in the performance reported to the indices are any additional fee layers which may be added on for a feeder fund or similar such access point to a manager. For example, we recently assisted a client of an Advisor we work with move over to an Attain fund from their investment in something called the Winton Direct fund.  The client assumed, like the reader mentioned above, that the reason he was up just 5% in his “Winton” investment over the past 5 years while Winton’s stated performance was +29% over the same time – was because Winton was reporting their performance gross of fees.

But that isn’t the case… Winton is reporting net of fees just like they’re supposed to and just like everyone else. The 25% difference between the investor’s returns and Winton’s reported returns isn’t due to a gross vs net problem – it was the investor’s access point, coming in through a big broker/dealer which was charging an additional 5% a year for the access. Maybe that’s an acceptable price to pay for access to the ‘Blue Chip’ manager of the managed futures space IF they are returning 25% per year. But when they are doing only 6% per year (NET of their fees), and you are paying 5% extra to access that 6% return – the numbers stop making sense in a hurry.

For a reminder on the various access points to managed futures and the layers of fees involved – here’s our handy chart breaking it down.  This can also show you how the indices can be net of fees, but not net of ALL possible fees. The managed futures indices are typically calculated from performance numbers reported after the first and second access points (the managed accounts and manager offered funds), not after the distributors (B/Ds and mutual fund wholesalers) have gotten their hands on them.
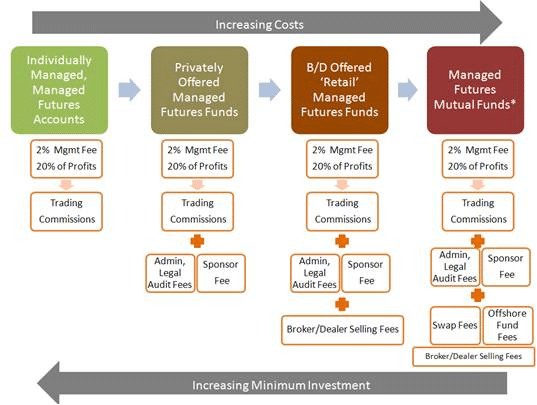
Chart of Fee Structure

One comment

  1. This chart doesn’t look right. Performance fees are assessed as a net of all the admin + legal, and especially the trading commissions. The flow of the chart implies the 2/20 management/performance is being assessed before trading commissions and other costs when it is the other way around.

Write a Comment

Disclaimer
The performance data displayed herein is compiled from various sources, including BarclayHedge, and reports directly from the advisors. These performance figures should not be relied on independent of the individual advisor's disclosure document, which has important information regarding the method of calculation used, whether or not the performance includes proprietary results, and other important footnotes on the advisor's track record.

The programs listed here are a sub-set of the full list of programs able to be accessed by subscribing to the database and reflect programs we currently work with and/or are more familiar with.

Benchmark index performance is for the constituents of that index only, and does not represent the entire universe of possible investments within that asset class. And further, that there can be limitations and biases to indices such as survivorship, self reporting, and instant history. Individuals cannot invest in the index itself, and actual rates of return may be significantly different and more volatile than those of the index.

Managed futures accounts can subject to substantial charges for management and advisory fees. The numbers within this website include all such fees, but it may be necessary for those accounts that are subject to these charges to make substantial trading profits in the future to avoid depletion or exhaustion of their assets.

Investors interested in investing with a managed futures program (excepting those programs which are offered exclusively to qualified eligible persons as that term is defined by CFTC regulation 4.7) will be required to receive and sign off on a disclosure document in compliance with certain CFT rules The disclosure documents contains a complete description of the principal risk factors and each fee to be charged to your account by the CTA, as well as the composite performance of accounts under the CTA's management over at least the most recent five years. Investor interested in investing in any of the programs on this website are urged to carefully read these disclosure documents, including, but not limited to the performance information, before investing in any such programs.

Those investors who are qualified eligible persons as that term is defined by CFTC regulation 4.7 and interested in investing in a program exempt from having to provide a disclosure document and considered by the regulations to be sophisticated enough to understand the risks and be able to interpret the accuracy and completeness of any performance information on their own.

RCM receives a portion of the commodity brokerage commissions you pay in connection with your futures trading and/or a portion of the interest income (if any) earned on an account's assets. The listed manager may also pay RCM a portion of the fees they receive from accounts introduced to them by RCM.

Limitations on RCM Quintile + Star Rankings

The Quintile Rankings and RCM Star Rankings shown here are provided for informational purposes only. RCM does not guarantee the accuracy, timeliness or completeness of this information. The ranking methodology is proprietary and the results have not been audited or verified by an independent third party. Some CTAs may employ trading programs or strategies that are riskier than others. CTAs may manage customer accounts differently than their model results shown or make different trades in actual customer accounts versus their own accounts. Different CTAs are subject to different market conditions and risks that can significantly impact actual results. RCM and its affiliates receive compensation from some of the rated CTAs. Investors should perform their own due diligence before investing with any CTA. This ranking information should not be the sole basis for any investment decision.

See the full terms of use and risk disclaimer here.

Disclaimer
The performance data displayed herein is compiled from various sources, including BarclayHedge, and reports directly from the advisors. These performance figures should not be relied on independent of the individual advisor's disclosure document, which has important information regarding the method of calculation used, whether or not the performance includes proprietary results, and other important footnotes on the advisor's track record.

The programs listed here are a sub-set of the full list of programs able to be accessed by subscribing to the database and reflect programs we currently work with and/or are more familiar with.

Benchmark index performance is for the constituents of that index only, and does not represent the entire universe of possible investments within that asset class. And further, that there can be limitations and biases to indices such as survivorship, self reporting, and instant history. Individuals cannot invest in the index itself, and actual rates of return may be significantly different and more volatile than those of the index.

Managed futures accounts can subject to substantial charges for management and advisory fees. The numbers within this website include all such fees, but it may be necessary for those accounts that are subject to these charges to make substantial trading profits in the future to avoid depletion or exhaustion of their assets.

Investors interested in investing with a managed futures program (excepting those programs which are offered exclusively to qualified eligible persons as that term is defined by CFTC regulation 4.7) will be required to receive and sign off on a disclosure document in compliance with certain CFT rules The disclosure documents contains a complete description of the principal risk factors and each fee to be charged to your account by the CTA, as well as the composite performance of accounts under the CTA's management over at least the most recent five years. Investor interested in investing in any of the programs on this website are urged to carefully read these disclosure documents, including, but not limited to the performance information, before investing in any such programs.

Those investors who are qualified eligible persons as that term is defined by CFTC regulation 4.7 and interested in investing in a program exempt from having to provide a disclosure document and considered by the regulations to be sophisticated enough to understand the risks and be able to interpret the accuracy and completeness of any performance information on their own.

RCM receives a portion of the commodity brokerage commissions you pay in connection with your futures trading and/or a portion of the interest income (if any) earned on an account's assets. The listed manager may also pay RCM a portion of the fees they receive from accounts introduced to them by RCM.

Limitations on RCM Quintile + Star Rankings

The Quintile Rankings and RCM Star Rankings shown here are provided for informational purposes only. RCM does not guarantee the accuracy, timeliness or completeness of this information. The ranking methodology is proprietary and the results have not been audited or verified by an independent third party. Some CTAs may employ trading programs or strategies that are riskier than others. CTAs may manage customer accounts differently than their model results shown or make different trades in actual customer accounts versus their own accounts. Different CTAs are subject to different market conditions and risks that can significantly impact actual results. RCM and its affiliates receive compensation from some of the rated CTAs. Investors should perform their own due diligence before investing with any CTA. This ranking information should not be the sole basis for any investment decision.

See the full terms of use and risk disclaimer here.

logo