

Asset Class Scoreboard: August 2026

Home » Attain Alternatives Blog » Asset Class Scoreboard: August 2026

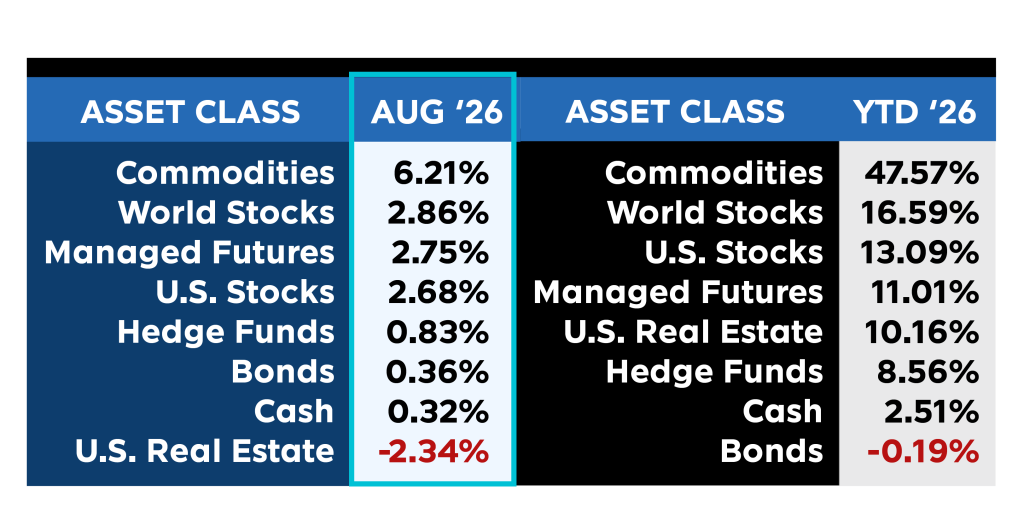
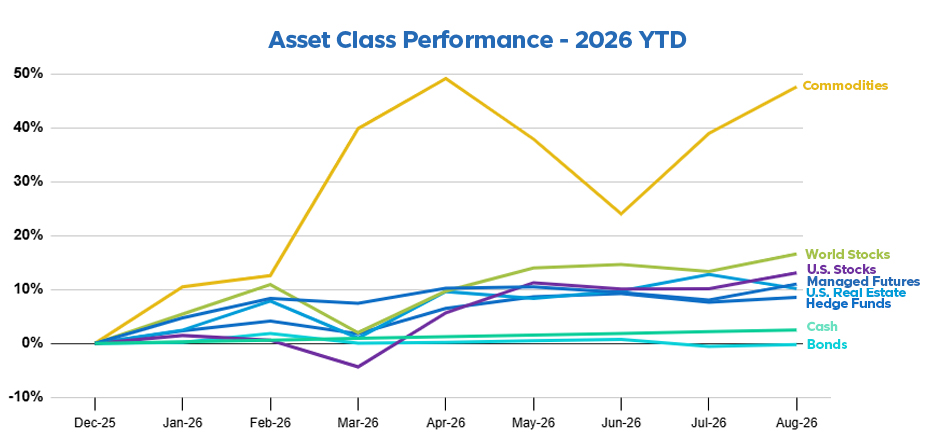
August 2026 delivered broad gains across the scoreboard, with Commodities continuing their run by adding +6.21% for the month. That advance lifted their year-to-date return to +47.57%, holding their sizable lead atop the board.

Managed Futures posted another positive month, gaining +2.75% in August and bringing their year-to-date return to +11.01%. This marked their third consecutive positive month following the June and July setbacks, and it kept them in the upper tier of the scoreboard alongside the equity categories.

Equities recovered after July’s softness, with World Stocks gaining +2.86% and U.S. Stocks rising +2.68%. Those moves pushed World Stocks to +16.59% and U.S. Stocks to +13.09% year-to-date, second and fourth respectively on the board.

Hedge Funds returned +0.83% in August, lifting their year-to-date figure to +8.56%, while Cash held steady with a +0.32% gain for a +2.51% return on the year. Bonds edged up +0.36% for the month but remained the lone asset class in negative territory year-to-date at -0.19%.

U.S. Real Estate was the exception in an otherwise positive month, declining -2.34% in August. Even with the pullback, it stayed positive for the year at +10.16%.

As August comes to a close, Commodities remain firmly in front, World Stocks hold second, and Managed Futures continue their steady climb after regaining their footing over the summer.
Past performance is not indicative of future results.
Past performance is not indicative of future results.

Sources: Managed Futures = SocGen CTA Index,
Cash = US T-Bill 13 week coupon equivalent annual rate/12, with YTD the sum of each month’s value,
Bonds = Vanguard Total Bond Market ETF (NYSEARCA:BND),
Hedge Funds = IQ Hedge Multi-Strategy Tracker ETF (NYSEARCA:QAI)
Commodities = iShares S&P GSCI Commodity-Indexed Trust ETF (NYSEARCA:GSG);
Real Estate = iShares U.S. Real Estate ETF (NYSEARCA:IYR);
World Stocks = iShares MSCI ACWI ex-U.S. ETF (NASDAQ:ACWX);
US Stocks = SPDR S&P 500 ETF (NYSEARCA:SPY)

All ETF performance data from Y Charts

Disclaimer Info

The performance data displayed herein is compiled from various sources, including BarclayHedge, and reports directly from the advisors. These performance figures should not be relied on independent of the individual advisor’s disclosure document, which has important information regarding the method of calculation used, whether or not the performance includes proprietary results, and other important footnotes on the advisor’s track record.


The programs listed here are a sub-set of the full list of programs able to be accessed by subscribing to the database and reflect programs we currently work with and/or are more familiar with.
Benchmark index performance is for the constituents of that index only, and does not represent the entire universe of possible investments within that asset class. And further, that there can be limitations and biases to indices such as survivorship, self reporting, and instant history. Individuals cannot invest in the index itself, and actual rates of return may be significantly different and more volatile than those of the index.


Managed futures accounts can subject to substantial charges for management and advisory fees. The numbers within this website include all such fees, but it may be necessary for those accounts that are subject to these charges to make substantial trading profits in the future to avoid depletion or exhaustion of their assets.


Investors interested in investing with a managed futures program (excepting those programs which are offered exclusively to qualified eligible persons as that term is defined by CFTC regulation 4.7) will be required to receive and sign off on a disclosure document in compliance with certain CFT rules The disclosure documents contains a complete description of the principal risk factors and each fee to be charged to your account by the CTA, as well as the composite performance of accounts under the CTA’s management over at least the most recent five years. Investor interested in investing in any of the programs on this website are urged to carefully read these disclosure documents, including, but not limited to the performance information, before investing in any such programs.


Those investors who are qualified eligible persons as that term is defined by CFTC regulation 4.7 and interested in investing in a program exempt from having to provide a disclosure document and considered by the regulations to be sophisticated enough to understand the risks and be able to interpret the accuracy and completeness of any performance information on their own.
RCM may receive a portion of the commodity brokerage commissions you pay in connection with your futures trading and/or a portion of the interest income (if any) earned on an account’s assets. The listed manager may also pay RCM a portion of the fees they receive from accounts introduced to them by RCM.


Limitations on RCM Quintile + Star Rankings


The Quintile Rankings and RCM Star Rankings shown here are provided for informational purposes only. RCM does not guarantee the accuracy, timeliness or completeness of this information. The ranking methodology is proprietary and the results have not been audited or verified by an independent third party. Some CTAs may employ trading programs or strategies that are riskier than others. CTAs may manage customer accounts differently than their model results shown or make different trades in actual customer accounts versus their own accounts. Different CTAs are subject to different market conditions and risks that can significantly impact actual results. RCM and its affiliates receive compensation from some of the rated CTAs. Investors should perform their own due diligence before investing with any CTA. This ranking information should not be the sole basis for any investment decision.


See the full terms of use and risk disclaimer here.