


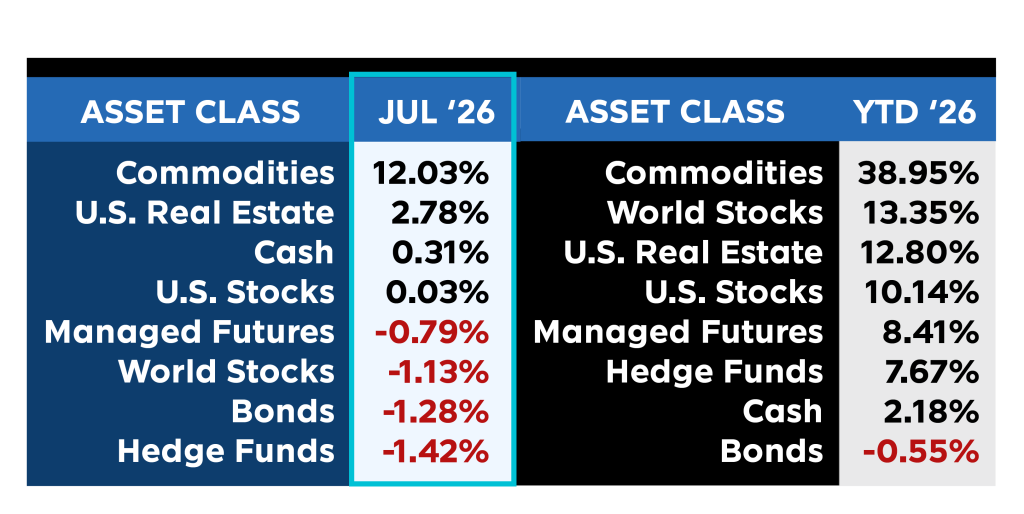
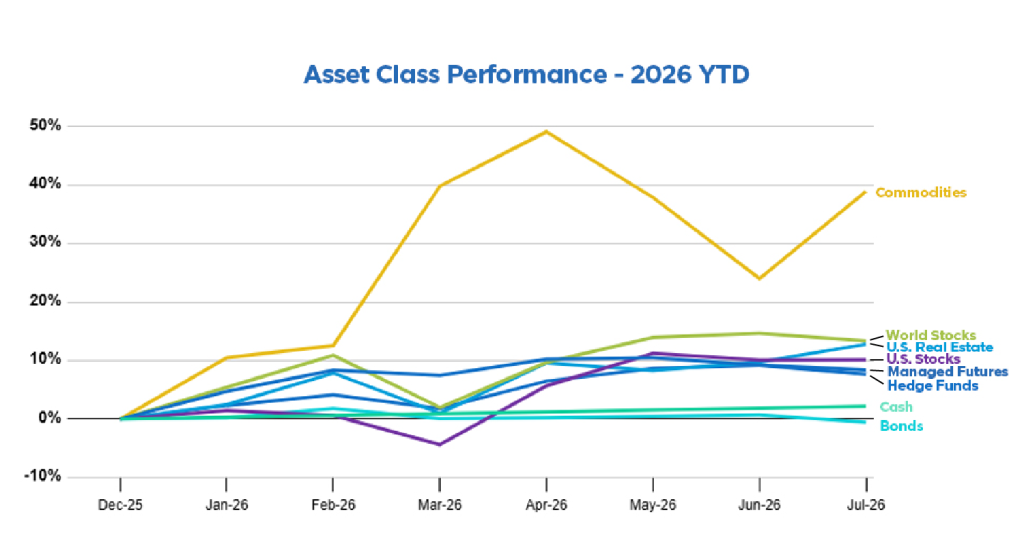
July 2026 flipped the recent script for Commodities, which jumped +12.03% for the month after two straight declines. That rebound pushed their year-to-date return to +38.95%, extending their lead atop the scoreboard.
Managed Futures were the standout mover behind them, gaining +3.77% in July — their strongest month since January. That advance lifted their year-to-date return to +13.40% and moved them into second place overall, narrowly ahead of World Stocks. Through seven months, Managed Futures have now posted positive returns in five of seven months, with their only setbacks being a -0.83% dip in March and a -1.09% decline in June.
U.S. Real Estate added +2.78% in July, bringing its year-to-date figure to +12.80%, while U.S. Stocks were essentially flat at +0.03%, holding at +10.14% for the year. World Stocks slipped -1.13% in the month, settling at +13.35% year-to-date and third place on the board.
The month proved tougher for the more defensive corners. Hedge Funds declined -1.42% in July, trimming their year-to-date return to +7.67%. Bonds fell -1.28% and turned negative for the year at -0.55%, becoming the first asset class to dip into the red in 2026. Cash held steady with a +0.31% gain, bringing its year-to-date return to +2.18%.
As July closes, Commodities remain firmly in front, Managed Futures have edged ahead of World Stocks for the runner-up spot, and Bonds stand as the lone asset class in negative territory year-to-date.
Past performance is not indicative of future results.
Sources: Managed Futures = SocGen CTA Index,
Cash = US T-Bill 13 week coupon equivalent annual rate/12, with YTD the sum of each month’s value,
Bonds = Vanguard Total Bond Market ETF (NYSEARCA:BND),
Hedge Funds = IQ Hedge Multi-Strategy Tracker ETF (NYSEARCA:QAI)
Commodities = iShares S&P GSCI Commodity-Indexed Trust ETF (NYSEARCA:GSG);
Real Estate = iShares U.S. Real Estate ETF (NYSEARCA:IYR);
World Stocks = iShares MSCI ACWI ex-U.S. ETF (NASDAQ:ACWX);
US Stocks = SPDR S&P 500 ETF (NYSEARCA:SPY)
All ETF performance data from Y Charts