


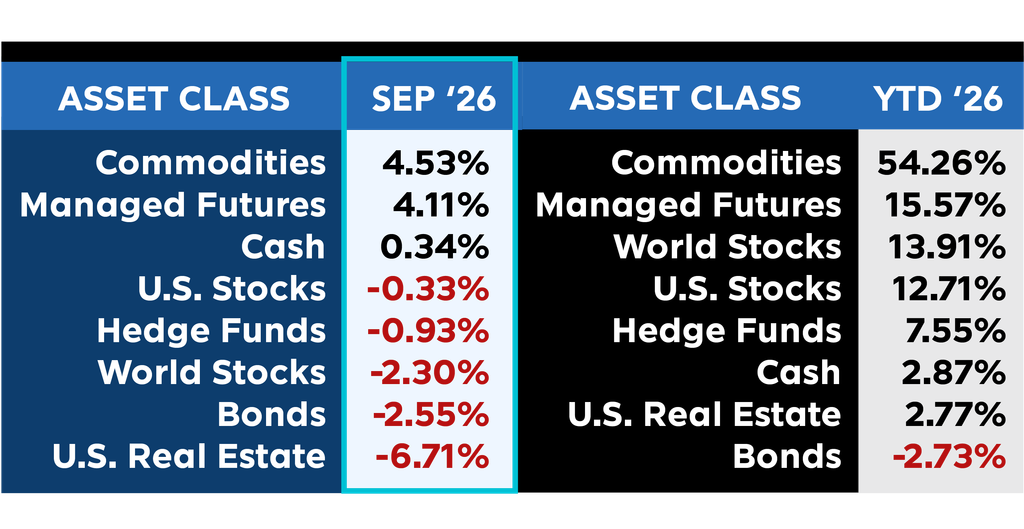
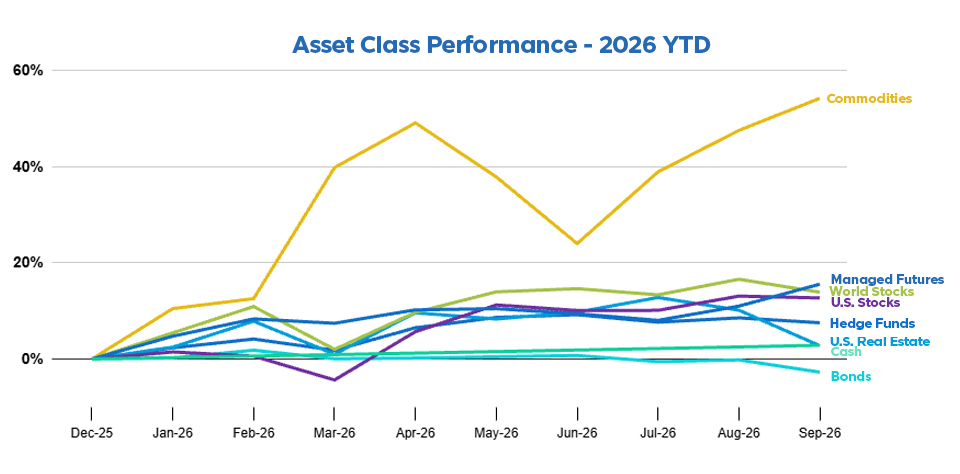
September 2026 brought a split in the scoreboard, as Managed Futures and Commodities advanced while most other categories declined. Managed Futures gained +4.11% for the month, its fourth consecutive positive month, lifting its year-to-date return to +15.57% and moving it into second place on the board.
Commodities continued to lead, adding +4.53% in September and extending their year-to-date return to +54.26%, holding the top spot by a wide margin.
Equities turned lower after August’s gains. World Stocks declined -2.30% and U.S. Stocks slipped -0.33% for the month. Those moves trimmed World Stocks to +13.91% year-to-date and U.S. Stocks to +12.71%.
Hedge Funds fell -0.93% in September, bringing their year-to-date figure to +7.55%, while Cash held steady with a +0.34% gain for a +2.87% return on the year. Bonds declined -2.55% for the month and remained the lone asset class in negative territory year-to-date at -2.73%.
U.S. Real Estate posted the largest monthly decline, falling -6.71% in September. The drop pulled its year-to-date return down to +2.77%.
As September comes to a close, Commodities remain firmly in front, Managed Futures has advanced to second after four straight positive months, and Bonds continue to sit alone in negative territory for the year.
Past performance is not indicative of future results.
Past performance is not indicative of future results.
Sources: Managed Futures = SocGen CTA Index,
Cash = US T-Bill 13 week coupon equivalent annual rate/12, with YTD the sum of each month’s value,
Bonds = Vanguard Total Bond Market ETF (NYSEARCA:BND),
Hedge Funds = IQ Hedge Multi-Strategy Tracker ETF (NYSEARCA:QAI)
Commodities = iShares S&P GSCI Commodity-Indexed Trust ETF (NYSEARCA:GSG);
Real Estate = iShares U.S. Real Estate ETF (NYSEARCA:IYR);
World Stocks = iShares MSCI ACWI ex-U.S. ETF (NASDAQ:ACWX);
US Stocks = SPDR S&P 500 ETF (NYSEARCA:SPY)
All ETF performance data from Y Charts