Past performance is not necessarily indicative of future results
Traders from “The Derivative”
New Strategies
Trend/Macro
High Sortino
Day Trading /Low Margin Usage
Institutional Ready
DISCLAIMER
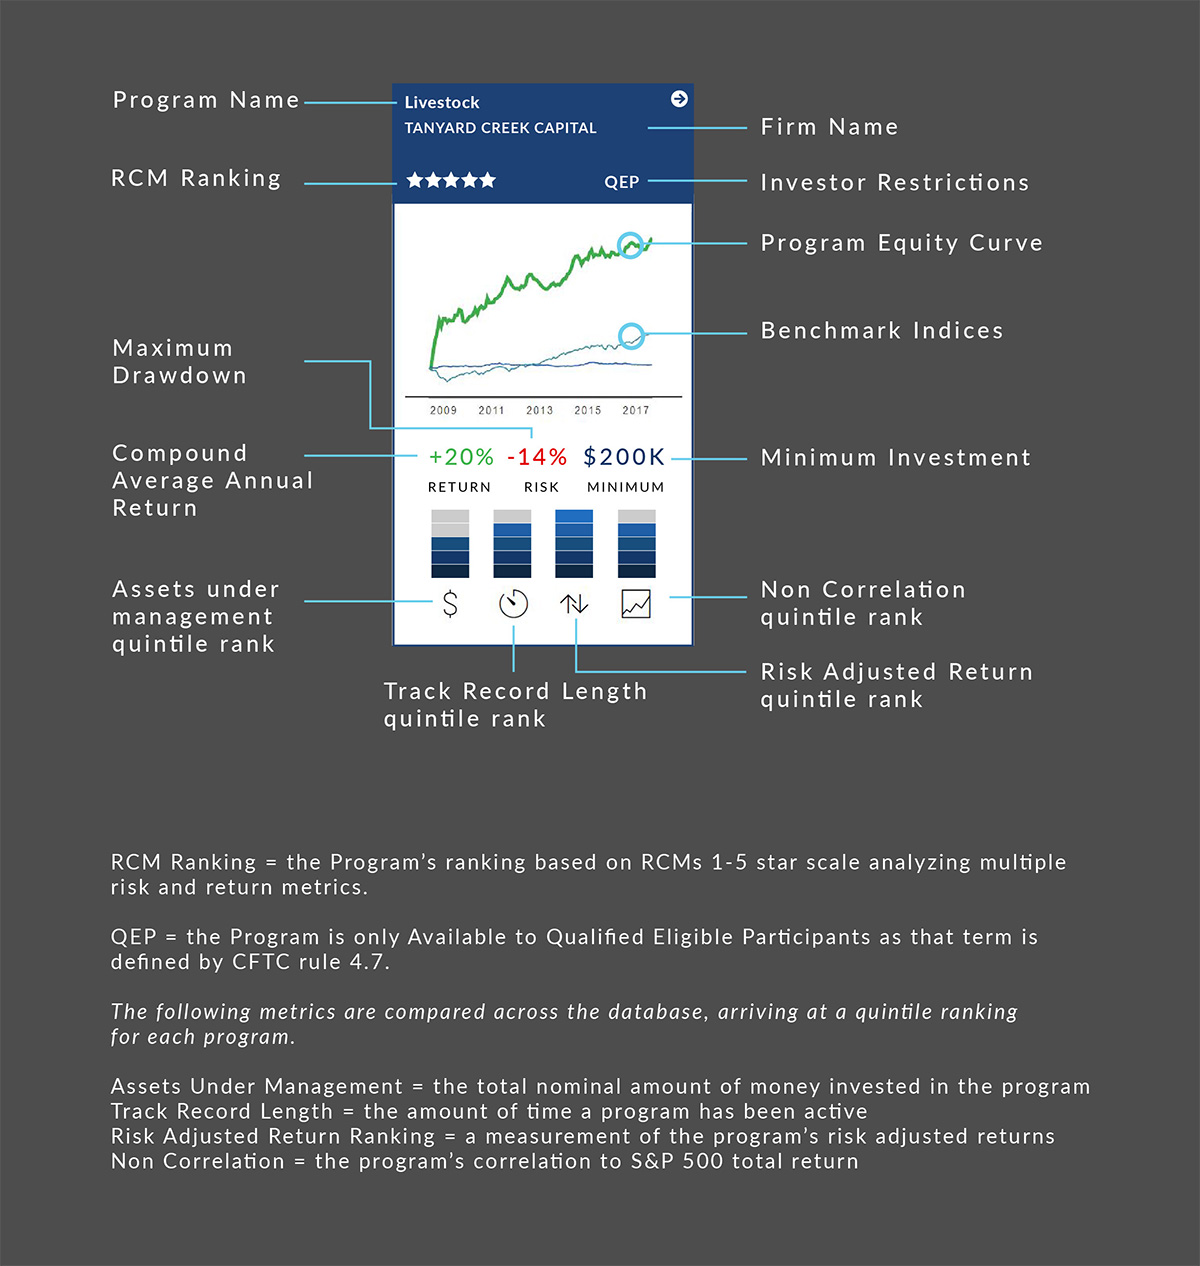
RCM Ranking = the Program’s ranking based on RCMs 1-5 star scale analyzing multiple risk and return metrics. All stats since inception. Return = the Compound Annual Rate of Return. Risk = the Max Peak to Valley Loss (Month End Basis). Minimum = the minimum investment amount. The following metrics are compared across the database, arriving at a quintile ranking for each program. Assets Under Management = the total amount of money invested in the program. Track Record Length = the amount of time a program has been active. Return/Risk Ranking = a measurement of the program’s risk adjusted returns. The value is determined by dividing the listed Return value by the listed Risk value. Stock Market Correlation = the program’s correlation to S&P 500 total return. QEP = the Program is only Available to Qualified Eligible Participants as that term is defined by CFTC rule 4.7.
Past performance is not necessarily indicative of future results
DISCLAIMER
RCM Ranking = the Program’s ranking based on RCMs 1-5 star scale analyzing multiple risk and return metrics. All stats since inception. Return = the Compound Annual Rate of Return. Risk = the Max Peak to Valley Loss (Month End Basis). Minimum = the minimum investment amount. The following metrics are compared across the database, arriving at a quintile ranking for each program. Assets Under Management = the total amount of money invested in the program. Track Record Length = the amount of time a program has been active. Return/Risk Ranking = a measurement of the program’s risk adjusted returns. The value is determined by dividing the listed Return value by the listed Risk value. Stock Market Correlation = the program’s correlation to S&P 500 total return. QEP = the Program is only Available to Qualified Eligible Participants as that term is defined by CFTC rule 4.7.


