It’s downright frigid in Chicago. Walking to the train this week felt like we were in one of our parents’ stories of walking to school in the snow and cold (uphill… both ways) It’s “A Christmas Story” tongue stuck on a pole kinda weather.

But we’re numbers people, did a little digging on the Weather Channel Website, and found that, “For First Time in 20 Years, Cold Records May Beat Warm Records in U.S..” And what do a lot of Americans use to heat their houses these days. It’s not Heating Oil. It’s Natural Gas, which has been taking on a decidedly winterized look the past two years, via this nice chart by EIA via the Motley Fool.
Chart Courtesy: EIA
“..natural gas prices are touching levels seen only twice previously over the last twenty years {in Boston} (during Hurricanes Katrina and Rita, with the second being the extreme commodity price run-up of 2008).”
On the futures side of things, for one reason or another, there has certainly been the development of a trend on the Natural gas side of things.

(Disclaimer: Past performance is not necessarily indicative of future results)
Chart Courtesy: Finviz.com
One could argue that this is somewhat surprising, especially given the rise in fracking for Natural Gas, suggesting that more supply wouldn’t push up prices (even with the cold temps). But does this really have anything to do with weather at all? The last time Natural Gas futures numbers were at this level was back in much balmier April.
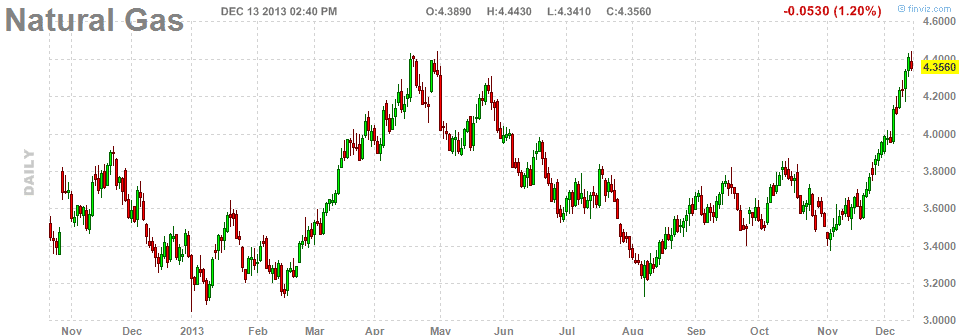
(Disclaimer: Past performance is not necessarily indicative of future results)
Chart Courtesy: Finviz.com
Those may look like some big moves up in April, down into August, and back up again since November. But Natural Gas really hasn’t been doing much of anything since the middle of 2009 as you can see below. Whether this trend persists remains to be seen, and boils down to whether there is enough perceived current and future demand (be it from gas powered furnaces or city buses converting to clean natural gas) to match the huge amount of supply?
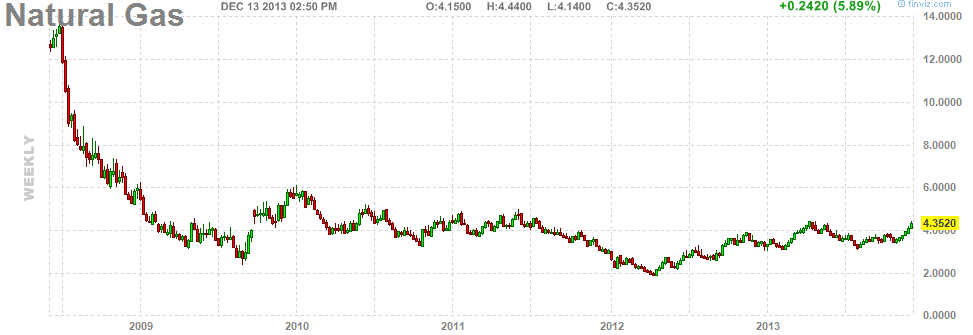 (Disclaimer: Past performance is not necessarily indicative of future results)
Chart Courtesy: Finviz.com
For now, we’ll keep cheering it higher for all those trend followers on the current up move, and our clients in the Gas business down Houston way.