Jeff Gundlach has become something of an investment guru over the past few years; first with the not so small feat of beating out the Bond King Gross rather consistently in building up DoubleLine from scratch to a firm managing $52 Billion in assets. And then, once in the spotlight, adding to the legend with some very prescient calls at various conferences and TV appearances. There was the original “Gundlach Spread”, where he called for going short Apple and long Natural Gas. Then the Short Yen, Long Nikkei spread.
Now, just when things were getting boring with new all time highs in the Dow last week, he’s back at it with a call to short the housing market, via Market Watch.
“I’m really kind of surprised by how copacetic people are about the homebuilders and housing markets. If you look at the data, in recent months it’s gotten really soft.”
And commentary from Market Watch:
“Home ownership for all age brackets is back to where it was in 1995. Meanwhile, ‘the kids aren’t alright,’ he says, noting bleak job prospects for young adults.
“Case-Shiller indicates rents will continue to rise, making it tougher for young people to save for downpayments while also struggling with student loans.”
Now, this isn’t necessarily the boldest statement he’s ever made. For starters, the Real Estate ETF $IYR made an impressive 204% return in the last 5 years, making it questionable it’s going to run up 200% over the next 5 years too. Then there’s this interesting chart by the Reformed Broker.
“Capital gains have not even been positive. From 1890 to 1990, real inflation-corrected home prices were virtually unchanged.”
(Disclaimer: Past performance is not necessarily indicative of future results)
Chart Courtesy: Reformed Broker
Yes, that line is practically unchanged since the end of WW2, and in stark contrast to the articles a few weeks ago saying the rich believe real estate is the best investment. Who’s right? And will Gundlach’s call be right on the housing market this time around? We’ll have to wait and see, but we can check in to see how his previous calls are going – although we don’t know when, if ever, he “got out” of these trades.
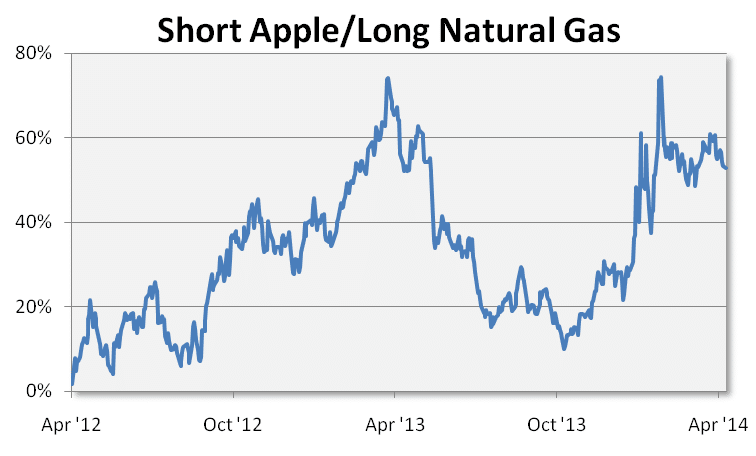
First, Short Apple/Long Natural Gas.
 (Disclaimer: Past performance is not necessarily indicative of future results)
This chart is certainly intriguing considering the recent performance of both $APPL and $NG_F. As of April of last year, Gundlach was sitting pretty with his predication showing above a 70% return. Then in a matter of 6 months, his return had dwindled down to only 10% after Apple started making up ground, while Natural Gas was stuck in a multiyear range bound volatility contraction. Lucky for Gundlach, the natural gas market exploded with volatility in the beginning of 2014. Our bet is he was out sometime in 2013… although you never know – the long Natural Gas could be a multi-year theme.
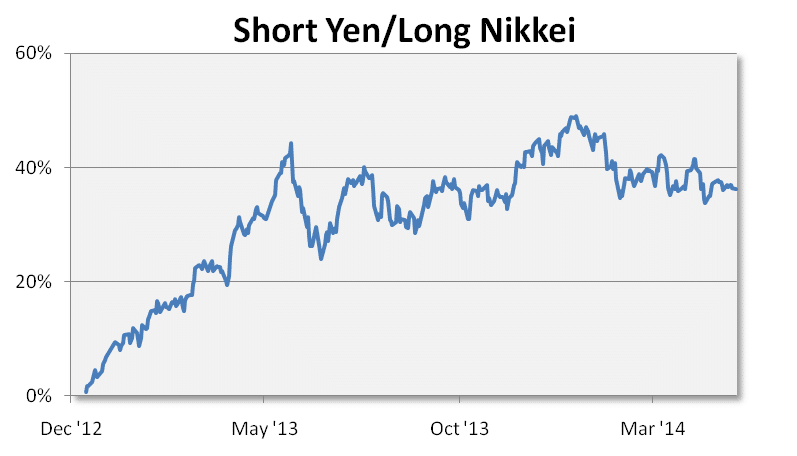
Next, Short Yen/Long Nikkei.
 (Disclaimer: Past performance is not necessarily indicative of future results)
Last year, we questioned whether the Yen carry trade had returned, and many systematic trend followers we track were definitely in on this position of shorting Yen and going long Nikkei. Since the start of 2012, the Yen is down almost 25%, as the Japanese economy continues to devalue its currency. But the question on everyone’s mind is what is going to be the breaking point for when the Yen is just too cheap and the devaluation has to stop? It can’t reach zero. When we see a turn around, how many people are going to be caught on the wrong side of the trade? And where’s Gundlach on it now? Still in? or Out?
Finally, his latest call to short gold in June 2013.
 (Disclaimer: Past performance is not necessarily indicative of future results)
Data = Back adjusted Gold Futures
His most recent call is by far that most unsuccessful, hovering at 2.6% {past performance is not necessarily indicative of future results}. Maybe he should stick to the spread trades instead of outright bets. Which would bring the most recent prediction into question – as it is an outright bet to go short the housing market. Stay tuned.


