Natural Gas ETFs – Heads You Lose, Tails You Lose More:

We did our monthly look at how various commodity ETFs track the futures markets they’re designed to follow recently, and found a rather interesting data point in Natural Gas.

Natural Gas(Disclaimer: Past performance is not necessarily indicative of future results)

Nautural Gas VAMI(Disclaimer: Past performance is not necessarily indicative of future results)
Natural Gas Futures = Selling the December Futures contract the last week of November (including exit costs), then using the following December contract numbers)

We’ve talked before about “3 Big Reasons Commodity ETF’s Aren’t Getting the Job Done,” and the usual picture is of the ETF underperforming the asset they track because of prices being in contango and a little thing called roll yield, which the ETFs have to pay if further out prices are more expensive than nearby prices, and if you look back at UNG since inception, it’s clear that the ETF underperforms a simple strategy of rolling the December futures annually:

Natural Gas Compare(Disclaimer: Past performance is not necessarily indicative of future results)

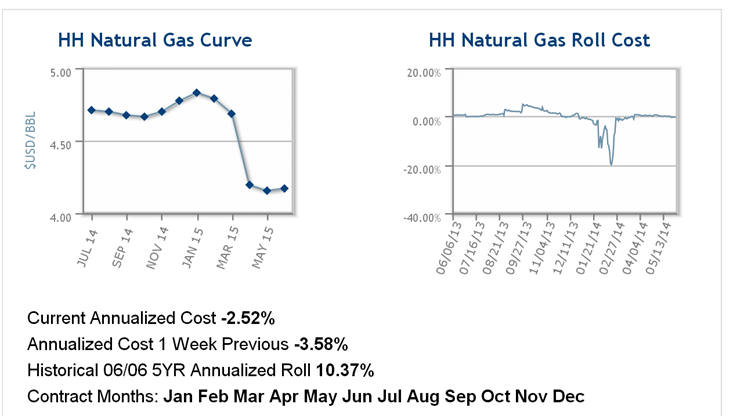
So why is UNG suddenly outperforming the December futures strategy?  You guessed it… Natural Gas has moved ever so slightly into Backwardation – the condition opposite ‘Contango’, where the near prices are more expensive than the further out prices. In that scenario, the ETF earns the roll yield instead of paying it. Here’s a nice graphic and stats from Hard Assets Investor: showing the 5yr annualized roll cost has been 10.37% (a cost of 10%), while the current roll cost is -2.5% (a benefit of 2.5%).

Natural Gas Backwardation detailsNatural Gas Chart Real Hard Investor
Charts Courtesy: Hard Assets Investor

But whether or not the futures are down -67% since 2009 or the worst ETF ever is down -78%, does it really matter. It’s kind of like being the cleanest dirty shirt or skinniest fat kid. You’ve still lost a boat load of money betting on the “energy of the future”.  And I guess that’s what the folks at Direxion and VelocityShares and ProShares were thinking when they launched Inverse Natural Gas products… and not just inverse, but 2x and 3x inverse. Why just go short, when you can double and triple your leverage? Direxion even got the great ticker – GASX – seemingly unconcerned with the link to the world’s number 1 brand for flatulence and bloating relief.

If you had to guess when these guys launched their inverse Natural Gas ETFs, what would you choose:

A. In mid-2008 when Natural Gas had risen ~100% over the last 12 months

B. In 2011 and 2012 when Natural Gas had fallen between 60% and 80% from its highs

Pat yourself on the back if you chose B. These funds were launched in a hurry to capitalize on the big move down in Natural Gas prices, just in time for prices to rally about 130% from their 2012 lows, just like the long Natural Gas ETF (UNG) launched just in time for Natural Gas to fall 80%.  A look at the all time charts for these ETFs is like watching a race to see who the first one to hit -100%.

Inverse Natural Gas(Disclaimer: Past performance is not necessarily indicative of future results)

We’re not sure if this is a commentary on the volatility of Natural Gas, on the dangers of turning futures markets into ‘safe looking’ ETFs, or on the age old problem of investors getting in exactly at the wrong point… but it sure is a weird set of circumstances when investors buying the long ETF are down about the same amount since inception as those buying the short ETF. They can’t win for losing. Here’s the sad performance since inception of the various Natural Gas ETFs:

Attention: The internal data of table “18” is corrupted!

Attention: The internal data of table “19” is corrupted!

(Disclaimer: Past performance is not necessarily indicative of future results)
Source: Google & Yahoo Finance


Write a Comment

Disclaimer
The performance data displayed herein is compiled from various sources, including BarclayHedge, and reports directly from the advisors. These performance figures should not be relied on independent of the individual advisor's disclosure document, which has important information regarding the method of calculation used, whether or not the performance includes proprietary results, and other important footnotes on the advisor's track record.

Benchmark index performance is for the constituents of that index only, and does not represent the entire universe of possible investments within that asset class. And further, that there can be limitations and biases to indices such as survivorship, self reporting, and instant history.

Managed futures accounts can subject to substantial charges for management and advisory fees. The numbers within this website include all such fees, but it may be necessary for those accounts that are subject to these charges to make substantial trading profits in the future to avoid depletion or exhaustion of their assets.

Investors interested in investing with a managed futures program (excepting those programs which are offered exclusively to qualified eligible persons as that term is defined by CFTC regulation 4.7) will be required to receive and sign off on a disclosure document in compliance with certain CFT rules The disclosure documents contains a complete description of the principal risk factors and each fee to be charged to your account by the CTA, as well as the composite performance of accounts under the CTA's management over at least the most recent five years. Investor interested in investing in any of the programs on this website are urged to carefully read these disclosure documents, including, but not limited to the performance information, before investing in any such programs.

Those investors who are qualified eligible persons as that term is defined by CFTC regulation 4.7 and interested in investing in a program exempt from having to provide a disclosure document and considered by the regulations to be sophisticated enough to understand the risks and be able to interpret the accuracy and completeness of any performance information on their own.

RCM receives a portion of the commodity brokerage commissions you pay in connection with your futures trading and/or a portion of the interest income (if any) earned on an account's assets. The listed manager may also pay RCM a portion of the fees they receive from accounts introduced to them by RCM.

See the full terms of use and risk disclaimer here.

logo