Since this down move started, the first question we get when talking to investors is: “When is crude going to find a bottom in the market?” For that, we’ll refer you to “How to Play a Bounce in Crude Oil (Hint: Not $USO).” Let’s face it, if you’re asking that question, then you want to play global macro discretionary trader for a day. Ignoring the metrics, the Bollinger Bands, the Average True Ranges — what are events telling us? Let’s pretend we’re a discretionary trader…
Before we know where we’re going, we need to know where we’ve been:
We’ll be the first to tell you past performance is not necessarily indicative of future results, but how much has crude moved lower relative to other big down moves? We haven’t seen crude oil below $40 since 2009. But it’s not just the fact that it’s near $40, it’s that it’s in the top 5 down moves of all time.
Worst Crude Declines in History:’85-’86: -63%’90-’91: -51%’96-’98: -53%’08-’09: -68%’14-Today: -59%
— Charlie Bilello, CMT (@MktOutperform) Aug. 12 at 10:26 AM
What’s been the impact of the drop?
If you have stock in Exxon or Chevron, things don’t look too optimistic, but for the average consumer, you actually have more spending power than you had last year without really knowing it. Since the oil’s drop, America’s 10 largest oil companies have lost a combined $200 billion in market cap, the Texas oil industry lost 8,300 jobs, and a handful of well publicized “commodity funds” have stopped trading or seen big losses (Andy Hall, Armajaro, etc). On the flip side, the energy department predicts this sort of drop will give U.S. consumers a combined $60 billion more spending power.
How does supply and demand work?
Well, given that our world increasingly runs on energy (from driving to manufacturing to charging iPhones) , and crude oil is responsible for at least 1/3rd of all energy used around the world, understanding the demand is rather intuitive. But OPEC, Shale, Brent, WTI, and the rest confuse the supply side somewhat. CNN Money provides a good explanation of how the global economic supply and demand chain works with crude oil in this video.
What’s with the recent down move?
Nobody knows for sure – the easiest answer is that investors and consumers want to pay less for it today than they did a few weeks ago. More complex answers involve China, the Saudis, improvements in technology, and all the rest. Here are some of the stats and fundamentals we have to digest as a discretionary guy.
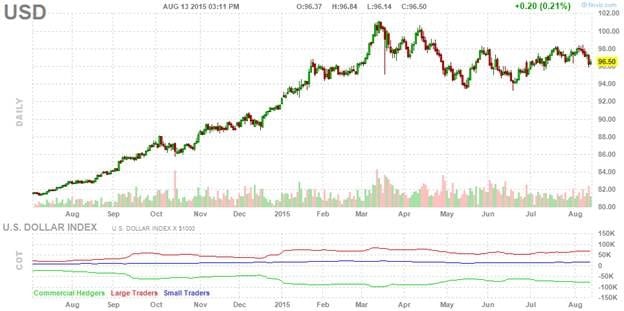
U.S. Dollar Strength
Remember that commodities like Gold, Corn, Cotton, and Oil are all priced in US Dollars – so all else being equal – a rising US Dollar means a falling commodity priced in US Dollars. That made perfect sense last year as we saw the US Dollar up and Oil down. It’s played out a little less so in 2015, with the USD having mainly been range bound.
 (Disclaimer: Past performance is not necessarily indicative of future results)
Chart Courtesy: Finviz
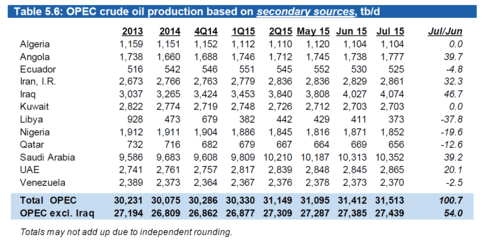
OPEC 3-year-highs Production
OPEC isn’t slowing down production, despite the plunge in price (or maybe they’re doing so on purpose to curse the Shale guys as some conspiracy theorist would have us believe). Just this week, they reported OPEC is at three year production highs. Here’s a table of the OPEC countries and their oil production month to month, via Bloomberg.
China Economic Slow Down
China is certainly dealing with a slowing economy with their markets tumbling, China’s central bank devaluing the Yuan, and China cutting their import of crude oil by 11% since last year. When one of the largest importers of oil cuts their import supply by 11% from a year prior, that’s something to pay attention to.
A Global Take
Speaking of which…oil plays a big role with global economics, not only because countries need it for energy, but also because its people do as well. Here’s a stellar interactive map looking at what percentage of GDP is reliant on crude oil imports or exports, via the Economist.
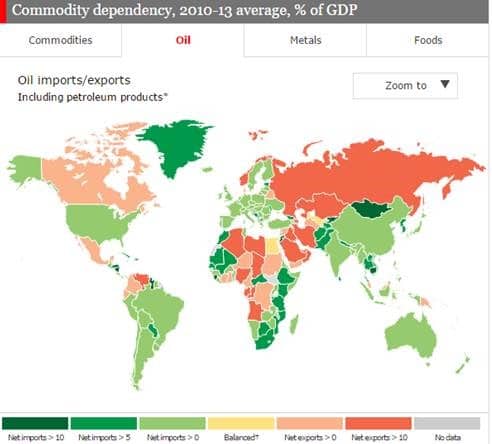 Chart Courtesy: The Economist
As a case study, the crude oil drop has really hit Ecuador’s economy hard, and that’s just one of the many countries whose economic stability is tied to the market.
Where will it go from here?
Will OPEC continue to increase oil production, price be damned? Will more oil rigs come online in the U.S. in anticipation of increased US economic activity? Will the lifting of Iranian sanctions increase production even more? On the flip side, if China cuts imports more, how low could oil go?
The real question for those looking to dig deep into the supply and demand of crude oil is: “What is the lowest it can go?” After all, it can’t go to zero, there will be some economic use for it, thereby giving it a value. But let’s be real, very few investors have the time to research the most recent happenings in the crude market, and by the time it’s being published online, the market has already reacted. And that’s just the energy market stuff. Don’t forget how ingrained with the US and world economy Crude is, meaning you’ll have to play world economist as well.
For our money, we’d much rather take emotions (and the hours and hours of work) out of it and rely on professionals approaching the market in a disciplined and systematic way; whether they are the trend following type, which won’t look to play a bounce until and unless the market breaks above recent highs and/or moves above moving averages, or professional commodity traders relying on fundamental data, but doing so in a systematic way where only so much is risked in case the market doesn’t react in the way they expect from the fundamentals.


