Infographic: The Highs and Lows of IPOs

It might surprise you to hear that despite the amount of effort that is going into covering new IPO’s like SNAP, fewer and fewer companies are doing it. In 1996 (rise of the dot com bubble), there were 706 initial public offerings; in 2016, there were only 105. A simple explanation of this could easily be that there were companies during that time that had no business going public, and the current numbers are inside the bell curve of normal.

One of the hyper focused IPO’s of 2017 happened to be the social media platform millennials love, and boomers and Gen X-ers are scratching their heads at. SnapChat $SNAP. So far it’s had a rocky start as they look to answer the question every social media company tries to answer: “How do we make money off of this?” Their answer is advertising, but if you take a look over in twitterland, they haven’t quite figured out how to monetize a medium that is used by the highest office in the land to address the nation. Baffling, right?

But IPO’s aren’t just for social media moguls. Telsa $TSLA is hitting new all-time highs, blowing other car companies stock prices out of the water. Amazon looks unstoppable (up 18% thus far in 2017), with reports that their poised to become a Trillion-dollar company, and the aforementioned Twitter all abuzz about how much they’ve grown since their IPO.

Let’s not forget about the IPO that isn’t getting the credit and attention it deserves, Dominos Pizza. They went public back in 2004 (along with Google), and Domino’s is now outpacing Google (Alphabet) in terms of stock price gains with +2,400% compared to +1,555%)! Who would have thought a staid old pizza company would provide a higher return than the king of the internet? There’s a joke in there somewhere.

But for every one of these success stories in IPO-land, there’s just as many tales of overpriced IPOs and unsuccessful enterprises like the infamous Pets.com or more recent examples like GoPro or Zynga.  The truth of the matter is that IPOs are a bit of a crap shoot. There’s no telling how the stock price is eventually going to turn out. If you had the wits about you to invest in Google or Amazon in the early days, you’re investing ego is probably as large as the size of those companies. If you tried your hand at some of the less fortunate companies like Twitter or eToys, you probably learned a lesson earlier than later about individual stock picking.

Which reminded us, we hadn’t done an infographic in a while; what better medium to check out the highs and lows of America’s favorite (investing) pastime – the IPO.  We redid the graphic originally found on StockTwits, adding some recent names, and some internet bubble burnouts, to give investors a little better picture of what going with a stock looks like. Check it out here…

(P.S. — If you would like to republish this, please find the embed code at the bottom of the post).


IPO investing infographic

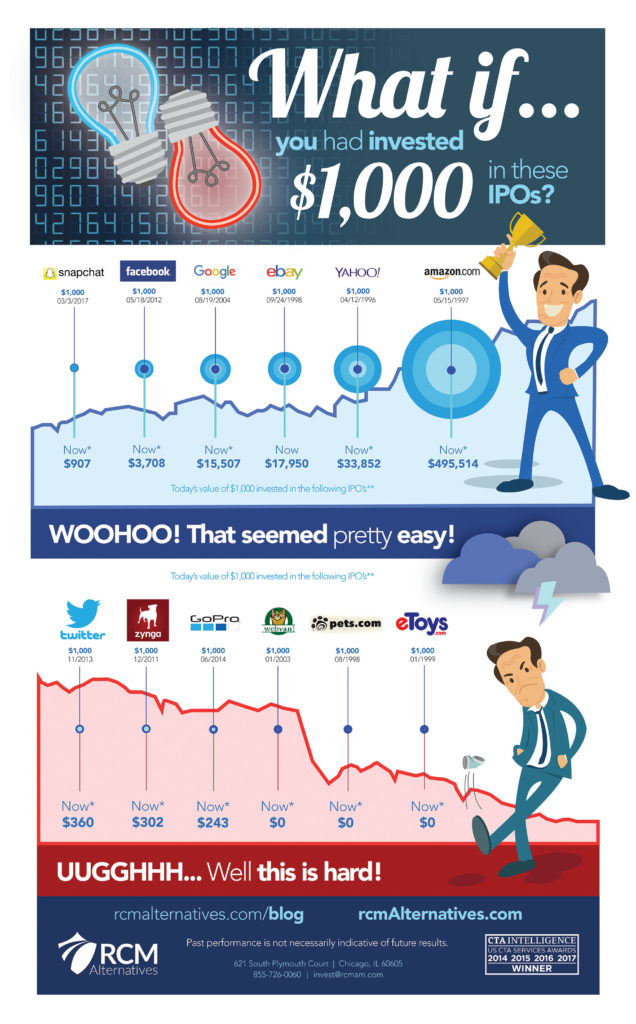
Infographic: The Highs and Lows of IPOs – An infographic by the team at Investing in IPOs

Embed Infographic: The Highs and Lows of IPOs on Your Site: Copy and Paste the Code Below

Disclaimer
The performance data displayed herein is compiled from various sources, including BarclayHedge, and reports directly from the advisors. These performance figures should not be relied on independent of the individual advisor's disclosure document, which has important information regarding the method of calculation used, whether or not the performance includes proprietary results, and other important footnotes on the advisor's track record.

The programs listed here are a sub-set of the full list of programs able to be accessed by subscribing to the database and reflect programs we currently work with and/or are more familiar with.

Benchmark index performance is for the constituents of that index only, and does not represent the entire universe of possible investments within that asset class. And further, that there can be limitations and biases to indices such as survivorship, self reporting, and instant history. Individuals cannot invest in the index itself, and actual rates of return may be significantly different and more volatile than those of the index.

Managed futures accounts can subject to substantial charges for management and advisory fees. The numbers within this website include all such fees, but it may be necessary for those accounts that are subject to these charges to make substantial trading profits in the future to avoid depletion or exhaustion of their assets.

Investors interested in investing with a managed futures program (excepting those programs which are offered exclusively to qualified eligible persons as that term is defined by CFTC regulation 4.7) will be required to receive and sign off on a disclosure document in compliance with certain CFT rules The disclosure documents contains a complete description of the principal risk factors and each fee to be charged to your account by the CTA, as well as the composite performance of accounts under the CTA's management over at least the most recent five years. Investor interested in investing in any of the programs on this website are urged to carefully read these disclosure documents, including, but not limited to the performance information, before investing in any such programs.

Those investors who are qualified eligible persons as that term is defined by CFTC regulation 4.7 and interested in investing in a program exempt from having to provide a disclosure document and considered by the regulations to be sophisticated enough to understand the risks and be able to interpret the accuracy and completeness of any performance information on their own.

RCM receives a portion of the commodity brokerage commissions you pay in connection with your futures trading and/or a portion of the interest income (if any) earned on an account's assets. The listed manager may also pay RCM a portion of the fees they receive from accounts introduced to them by RCM.

Limitations on RCM Quintile + Star Rankings

The Quintile Rankings and RCM Star Rankings shown here are provided for informational purposes only. RCM does not guarantee the accuracy, timeliness or completeness of this information. The ranking methodology is proprietary and the results have not been audited or verified by an independent third party. Some CTAs may employ trading programs or strategies that are riskier than others. CTAs may manage customer accounts differently than their model results shown or make different trades in actual customer accounts versus their own accounts. Different CTAs are subject to different market conditions and risks that can significantly impact actual results. RCM and its affiliates receive compensation from some of the rated CTAs. Investors should perform their own due diligence before investing with any CTA. This ranking information should not be the sole basis for any investment decision.

See the full terms of use and risk disclaimer here.

logo