October 25, 2018
rcm-alternatives
Like
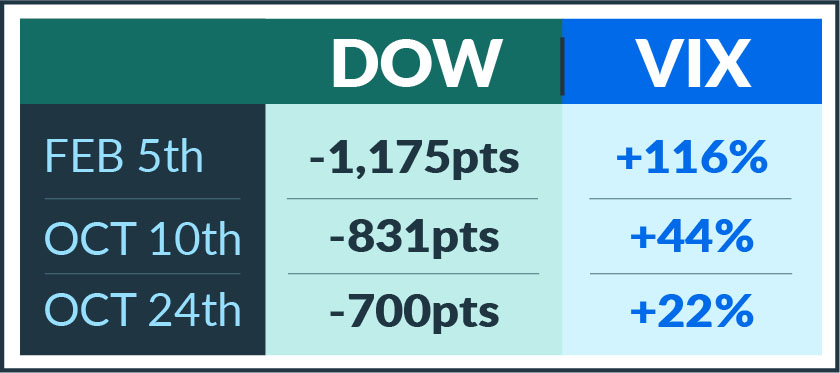
We jokingly tweeted out yesterday how the VIX’s three different reactions to seemingly similar market sell offs this year has reminded us of the many faces of Jim Carrey. Here’s the imagery to go along with that concept:


But all jokes aside, it’s worth noting the movement of the VIX during these somewhat big sell offs declines in a non-linear fashion in relation to the decline in the point drop. We’ve covered time and again how we live in extremistan, to borrow a phrase from Nassim Taleb, where Jeff Bezos wealth is 100s of standard deviations above the mean, but that’s typically in relation to the point drop itself, not the quad-rivative that is the VIX (a derivative of an index of a derivative of an index). Now we see it in the VIX, where the first such move is shocking, the next one upsetting, and the third one little more than an eyebrow raise.

We were reminded of a comment from Pearl (who recently completed their 3rd full year of trading) Capital Management’s Tim Jacobson at a former panel discussion on VIX trading, where he said:
….to think of the VIX as a radar screen – where all of the known information the market is reflected on the screen in various blips and dots. The sum of all that information comes out to be the current VIX level. Continuing, he stated that unless one of those known blips becomes larger, or a new unforeseen blip hits the screen, the VIX won’t move. The larger the blip and more unexpected its arrival on your screen (and closeness to your ship) the larger the movement in the VIX will be.
While most of us think of the VIX going up when the stock market goes down, that isn’t technically what it’s doing. It’s measuring the increase/decrease in premiums on a basket of options on the stock market, so reacting to not just the movement, but also the violence of that movement, and the unexpectedness of it. Yesterday’s sell off, on the heels of an already weak market, we decidedly not unexpected, thus the muted reaction from the VIX. Indeed, it’s possible for the VIX to actually fall while the stock market is falling – if the drop is less than what was expected. Imagine a scenario where the market falls -300 points a day for a few days. The first day is going to be that big new blip on the radar screen, shooting the VIX higher and putting everyone on high alert. But the following beeps on the radar screen will be in the same spot at the same distance, telling investors to remain concerned, but concerned in a known unknown sort of way. The spikes and outliers come from the unknown unknowns.
Disclaimer
The performance data displayed herein is compiled from various sources, including BarclayHedge, and reports directly from the advisors. These performance figures should not be relied on independent of the individual advisor's disclosure document, which has important information regarding the method of calculation used, whether or not the performance includes proprietary results, and other important footnotes on the advisor's track record.
The programs listed here are a sub-set of the full list of programs able to be accessed by subscribing to the database and reflect programs we currently work with and/or are more familiar with.
Benchmark index performance is for the constituents of that index only, and does not represent the entire universe of possible investments within that asset class. And further, that there can be limitations and biases to indices such as survivorship, self reporting, and instant history. Individuals cannot invest in the index itself, and actual rates of return may be significantly different and more volatile than those of the index.
Managed futures accounts can subject to substantial charges for management and advisory fees. The numbers within this website include all such fees, but it may be necessary for those accounts that are subject to these charges to make substantial trading profits in the future to avoid depletion or exhaustion of their assets.
Investors interested in investing with a managed futures program (excepting those programs which are offered exclusively to qualified eligible persons as that term is defined by CFTC regulation 4.7) will be required to receive and sign off on a disclosure document in compliance with certain CFT rules The disclosure documents contains a complete description of the principal risk factors and each fee to be charged to your account by the CTA, as well as the composite performance of accounts under the CTA's management over at least the most recent five years. Investor interested in investing in any of the programs on this website are urged to carefully read these disclosure documents, including, but not limited to the performance information, before investing in any such programs.
Those investors who are qualified eligible persons as that term is defined by CFTC regulation 4.7 and interested in investing in a program exempt from having to provide a disclosure document and considered by the regulations to be sophisticated enough to understand the risks and be able to interpret the accuracy and completeness of any performance information on their own.
RCM receives a portion of the commodity brokerage commissions you pay in connection with your futures trading and/or a portion of the interest income (if any) earned on an account's assets. The listed manager may also pay RCM a portion of the fees they receive from accounts introduced to them by RCM.
Limitations on RCM Quintile + Star Rankings
The Quintile Rankings and RCM Star Rankings shown here are provided for informational purposes only. RCM does not guarantee the accuracy, timeliness or completeness of this information. The ranking methodology is proprietary and the results have not been audited or verified by an independent third party. Some CTAs may employ trading programs or strategies that are riskier than others. CTAs may manage customer accounts differently than their model results shown or make different trades in actual customer accounts versus their own accounts. Different CTAs are subject to different market conditions and risks that can significantly impact actual results. RCM and its affiliates receive compensation from some of the rated CTAs. Investors should perform their own due diligence before investing with any CTA. This ranking information should not be the sole basis for any investment decision.
See the full terms of use and risk disclaimer here.


