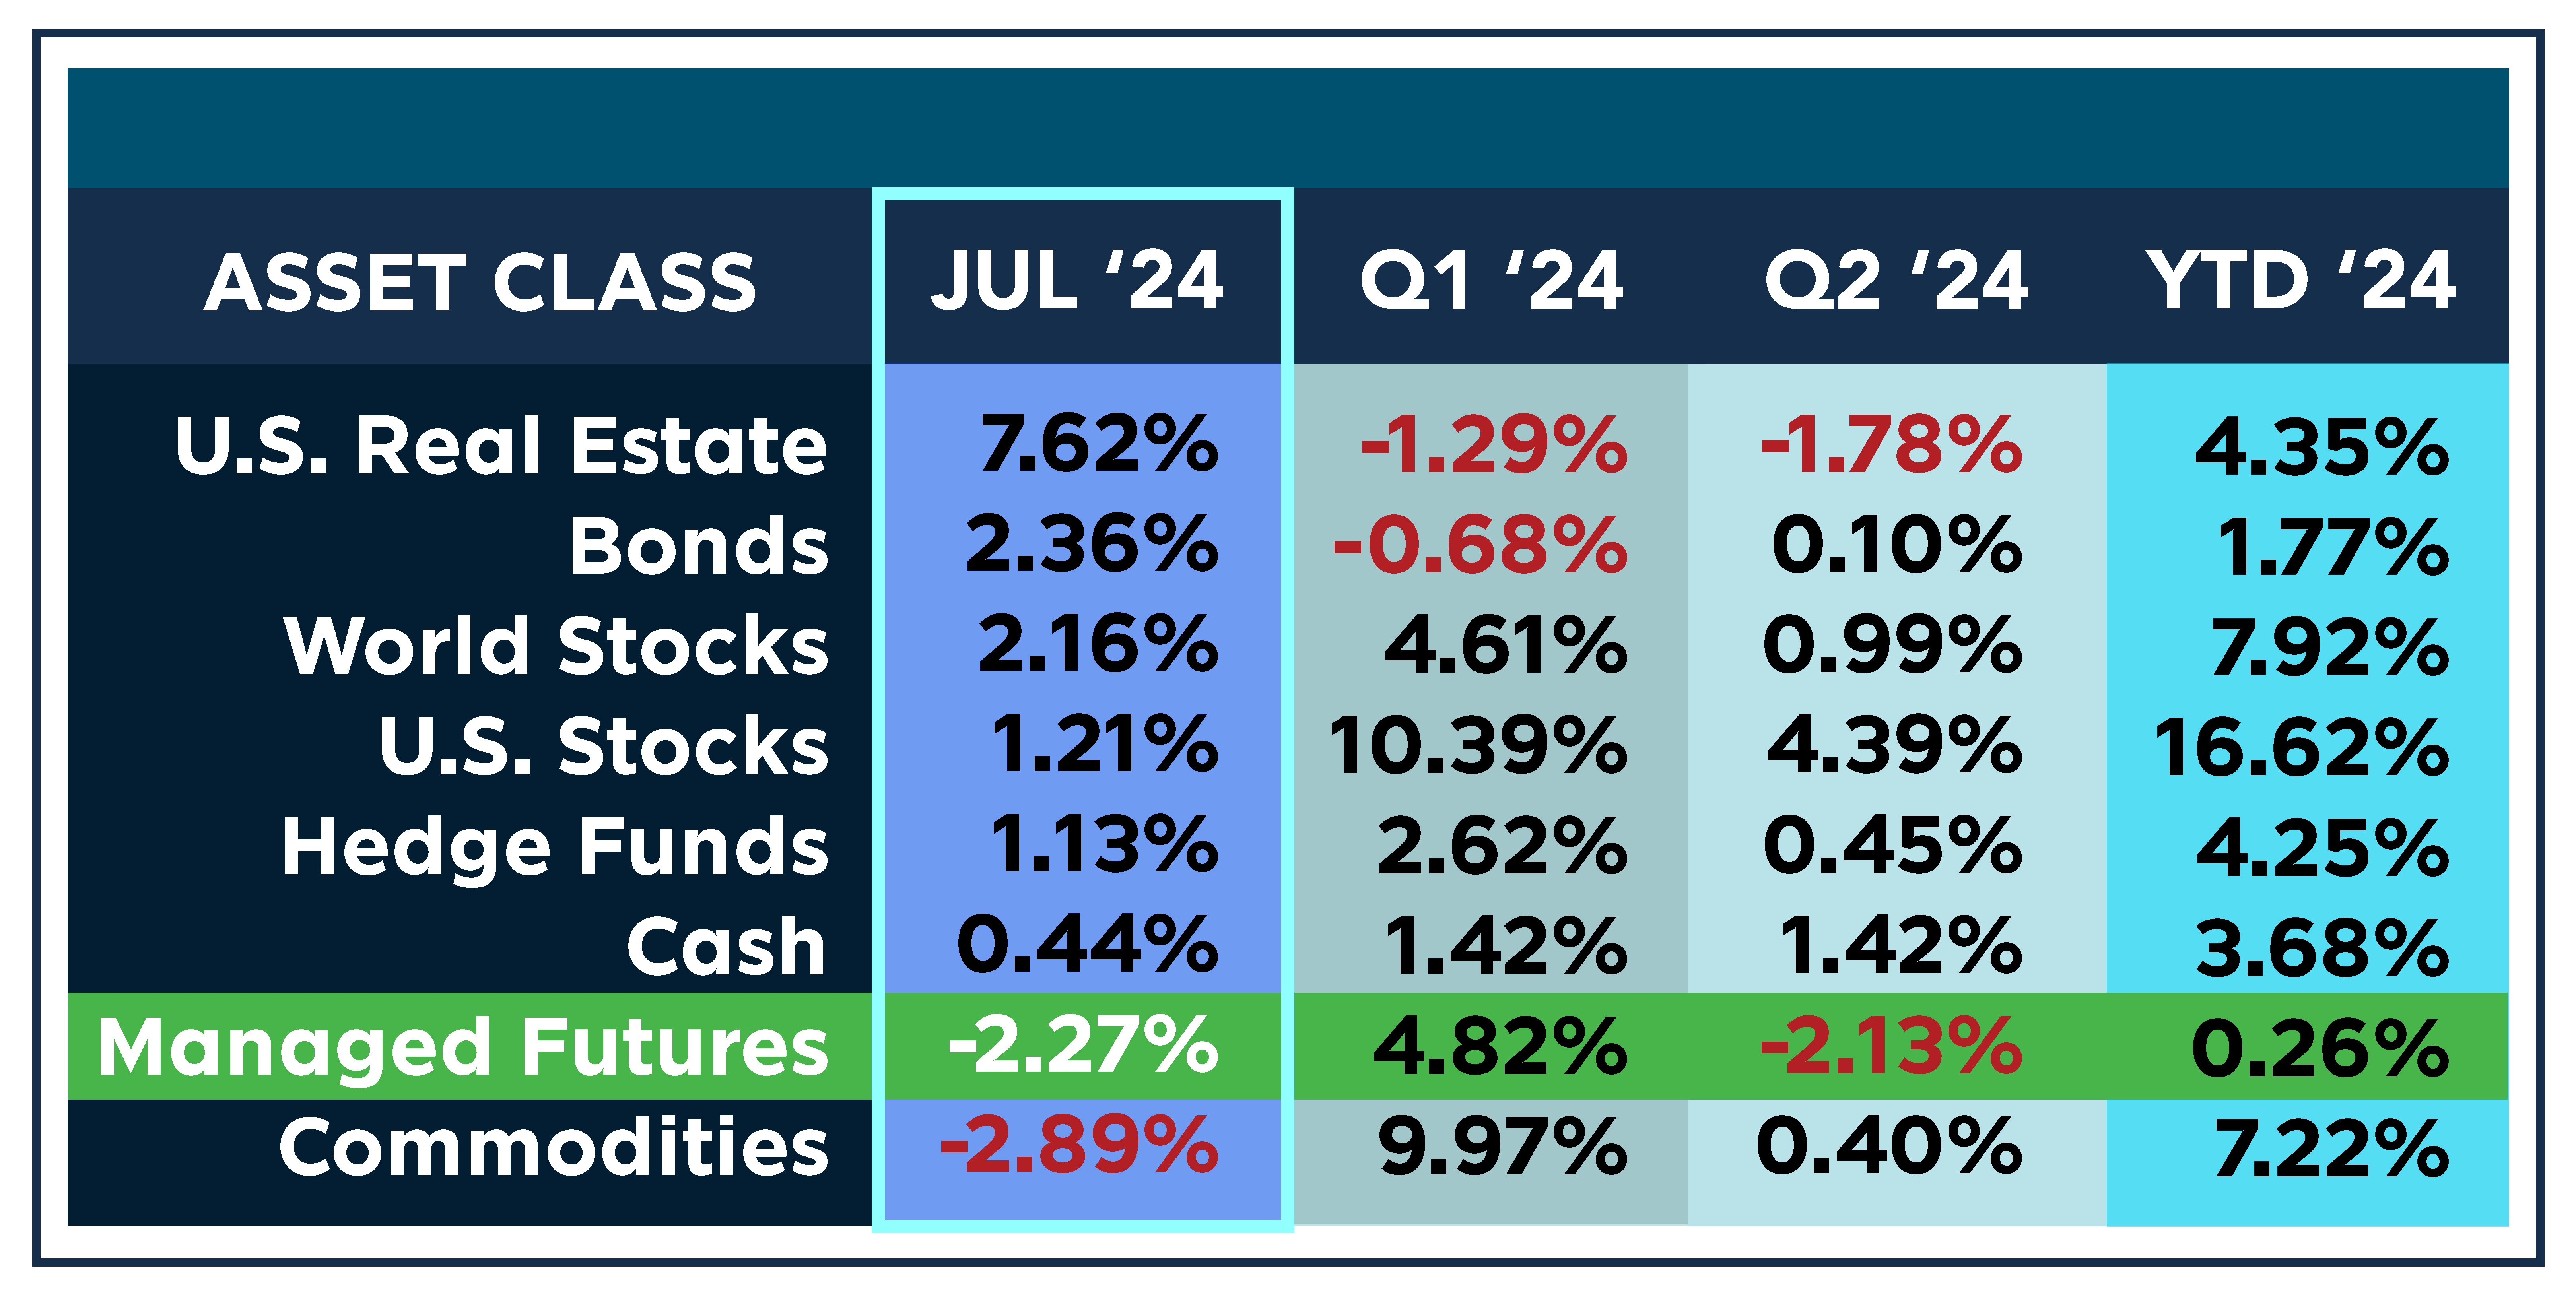
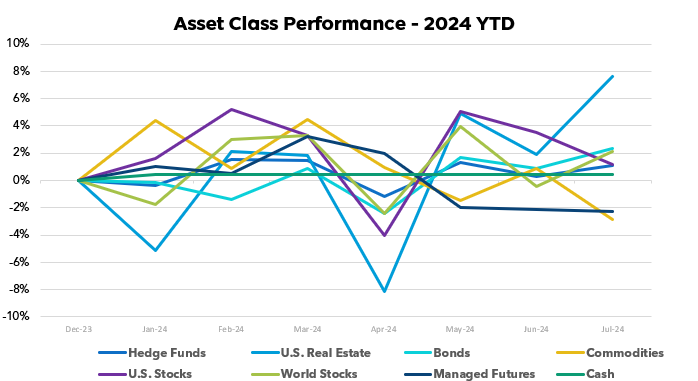
Kicking off in the third quarter, the month of July delivered a moderately positive performance across the major asset classes. There were not exceedingly great gains, but mostly, all were above the red, with only a couple suffering from declines.
Commodities retreated, with the GSG index slipping -2.89% and falling to the bottom of the chart. Though relatively strong initially, they have begun to lose their luster coming off the 2nd and starting this 3rd quarter. Managed futures strategies took another hit for a third consecutive month, posting a loss similar to last month’s at -2.27%, but rose a spot on the scoreboard, giving us some hope in the coming months, suggesting some challenges in navigating the fluctuating commodity and broader market environment.
On the positive side, the fixed-income space saw a solid rebound, with the BND index gaining +2.36%. This could be attributed to a moderation in interest rate hike expectations, which provided a tailwind for the bond market.
U.S. real estate stood out as the star performer in July, surging +7.62% as the sector benefited from the easing rate environment and improving economic sentiment, with the housing market flipping from the bottom of the chart in January to the top.
Hedge funds demonstrated their resilience, delivering a +1.13% return. Their ability to generate positive performance even in choppier market conditions highlights the diversification benefits they can provide to investor portfolios.
The U.S. equity market gained +1.21%, while its global counterparts rose +2.16%. This relative outperformance of international stocks could reflect improved economic data and reduced geopolitical tensions in certain regions. Cash holdings provided a steady +0.44% return, underscoring their defensive utility in the current climate.
This slight shift in results in July highlights the need for a balanced, well-diversified portfolio that can withstand the ebb and flow of different asset class trends.

Past performance is not indicative of future results.

Past performance is not indicative of future results.
Sources: Managed Futures = SocGen CTA Index,
Cash = US T-Bill 13 week coupon equivalent annual rate/12, with YTD the sum of each month’s value,
Bonds = Vanguard Total Bond Market ETF (NYSEARCA:BND),
Hedge Funds = IQ Hedge Multi-Strategy Tracker ETF (NYSEARCA:QAI)
Commodities = iShares S&P GSCI Commodity-Indexed Trust ETF (NYSEARCA:GSG);
Real Estate = iShares U.S. Real Estate ETF (NYSEARCA:IYR);
World Stocks = iShares MSCI ACWI ex-U.S. ETF (NASDAQ:ACWX);
US Stocks = SPDR S&P 500 ETF (NYSEARCA:SPY)
All ETF performance data from Y Charts


