Chart of the Week: The Futures Markets’ Sideways Bell Curve

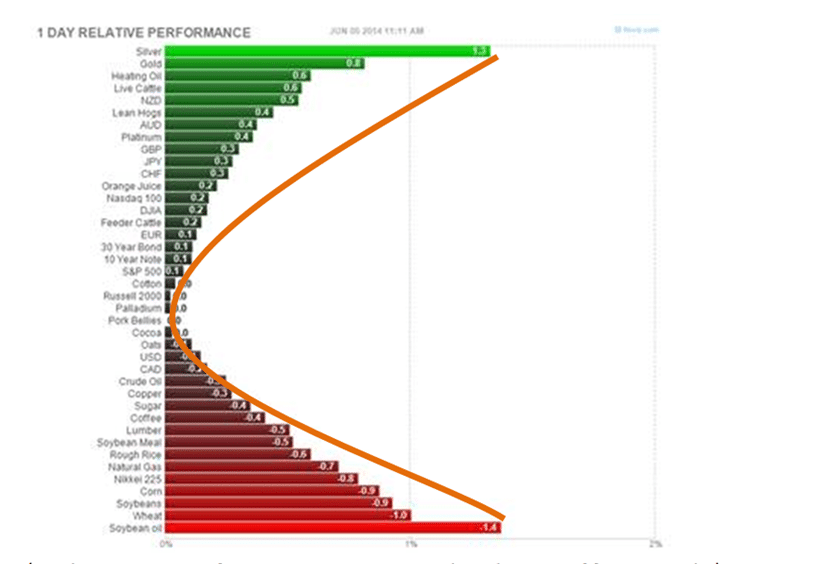
Drilling down to the day-to-day gains & losses can be dangerous for your wallet and psyche when analyzing trend followers, but when we checked out today’s futures market performance on Finviz we noticed something unique… a sideways bell curve.

Day Performance(Disclaimer: Past performance is not necessarily indicative of future results)
Chart Courtesy: Finviz

While most people grew up excited to hear that their teacher/professor was going to grade the test (you didn’t study for) on a bell curve (the highest grade in the class becomes the 100%, and each grade is adjusted from there), this sideways bell curve means something a little different.

You see, when the futures markets work in tandem to average a gain of over 1% or average losses over -1%,  it’s referred to as a Risk On/Risk Off day. (See our most recent 2014 Scoreboard here). But this might be a perfect example of a day showing an average return of 0%, meaning, each market is zigging, while the others are zagging.

What does this mean for trend followers as well as other managed futures strategies? Well, nothing really. Trend followers love to see charts like this, but one day isn’t enough for managers to capitalize off of their trends. They want to see days like this repeat themselves for months, and hopefully even years. The wheat market is continuing its down trend over from May into June, now down 16 of the last 19 days, but managers want to see a trend like that continue for months to come, with no reversion.

Managed futures don’t just need markets moving on their own – they need them moving on their own in a consistent direction.

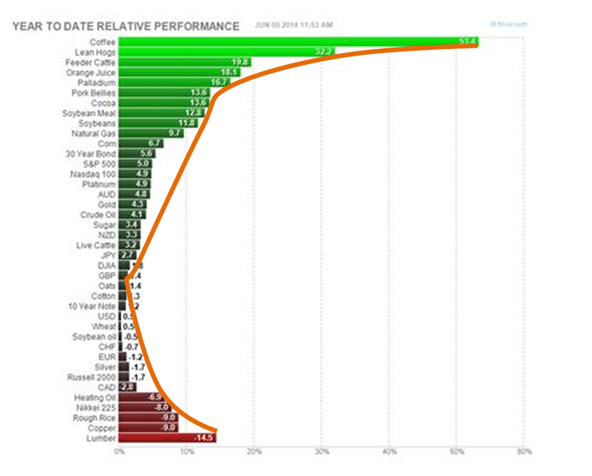
For example, the curve isn’t so even if you look at the YTD performance, with 22 of the 40 markets only showing a positive or negative 5% performance YTD {Disclaimer: Past performance is not necessarily indicative of future results}.

YTD performance(Disclaimer: Past performance is not necessarily indicative of future results)
Chart Courtesy: Finviz

Write a Comment

Disclaimer
The performance data displayed herein is compiled from various sources, including BarclayHedge, and reports directly from the advisors. These performance figures should not be relied on independent of the individual advisor's disclosure document, which has important information regarding the method of calculation used, whether or not the performance includes proprietary results, and other important footnotes on the advisor's track record.

The programs listed here are a sub-set of the full list of programs able to be accessed by subscribing to the database and reflect programs we currently work with and/or are more familiar with.

Benchmark index performance is for the constituents of that index only, and does not represent the entire universe of possible investments within that asset class. And further, that there can be limitations and biases to indices such as survivorship, self reporting, and instant history. Individuals cannot invest in the index itself, and actual rates of return may be significantly different and more volatile than those of the index.

Managed futures accounts can subject to substantial charges for management and advisory fees. The numbers within this website include all such fees, but it may be necessary for those accounts that are subject to these charges to make substantial trading profits in the future to avoid depletion or exhaustion of their assets.

Investors interested in investing with a managed futures program (excepting those programs which are offered exclusively to qualified eligible persons as that term is defined by CFTC regulation 4.7) will be required to receive and sign off on a disclosure document in compliance with certain CFT rules The disclosure documents contains a complete description of the principal risk factors and each fee to be charged to your account by the CTA, as well as the composite performance of accounts under the CTA's management over at least the most recent five years. Investor interested in investing in any of the programs on this website are urged to carefully read these disclosure documents, including, but not limited to the performance information, before investing in any such programs.

Those investors who are qualified eligible persons as that term is defined by CFTC regulation 4.7 and interested in investing in a program exempt from having to provide a disclosure document and considered by the regulations to be sophisticated enough to understand the risks and be able to interpret the accuracy and completeness of any performance information on their own.

RCM receives a portion of the commodity brokerage commissions you pay in connection with your futures trading and/or a portion of the interest income (if any) earned on an account's assets. The listed manager may also pay RCM a portion of the fees they receive from accounts introduced to them by RCM.

Limitations on RCM Quintile + Star Rankings

The Quintile Rankings and RCM Star Rankings shown here are provided for informational purposes only. RCM does not guarantee the accuracy, timeliness or completeness of this information. The ranking methodology is proprietary and the results have not been audited or verified by an independent third party. Some CTAs may employ trading programs or strategies that are riskier than others. CTAs may manage customer accounts differently than their model results shown or make different trades in actual customer accounts versus their own accounts. Different CTAs are subject to different market conditions and risks that can significantly impact actual results. RCM and its affiliates receive compensation from some of the rated CTAs. Investors should perform their own due diligence before investing with any CTA. This ranking information should not be the sole basis for any investment decision.

See the full terms of use and risk disclaimer here.

logo