

Here’s the thing about volatile markets: when things are getting hit, you look at home first. It’s reflexive. Your newsfeed is dialed to the S&P, CNBC’s on in the background, the watchlist on your phone (fine, your watch) is 80% U.S. tickers. That’s where the bleeding is, that’s where your attention goes.
But now? The smoke has cleared — not actually, or entirely yet, in the Middle East, but enough. The tape has ripped far enough off the lows that it’s worth lifting your head up and poking around. Who else rallied? Who won, who lost, who got left behind?
Our minds somehow went right to the MEGA trade, which seemingly every sell-side strategist was pitching this time last year. We honestly lost track of that narrative? Is it back, did it leave?
So has this just been another Nasdaq-led, AI-fueled U.S. victory lap? Or is the MEGA trade kicking in to? Who’s winning?
[checks notes] Neither!?! What?! It wasn’t U.S. It wasn’t Europe.
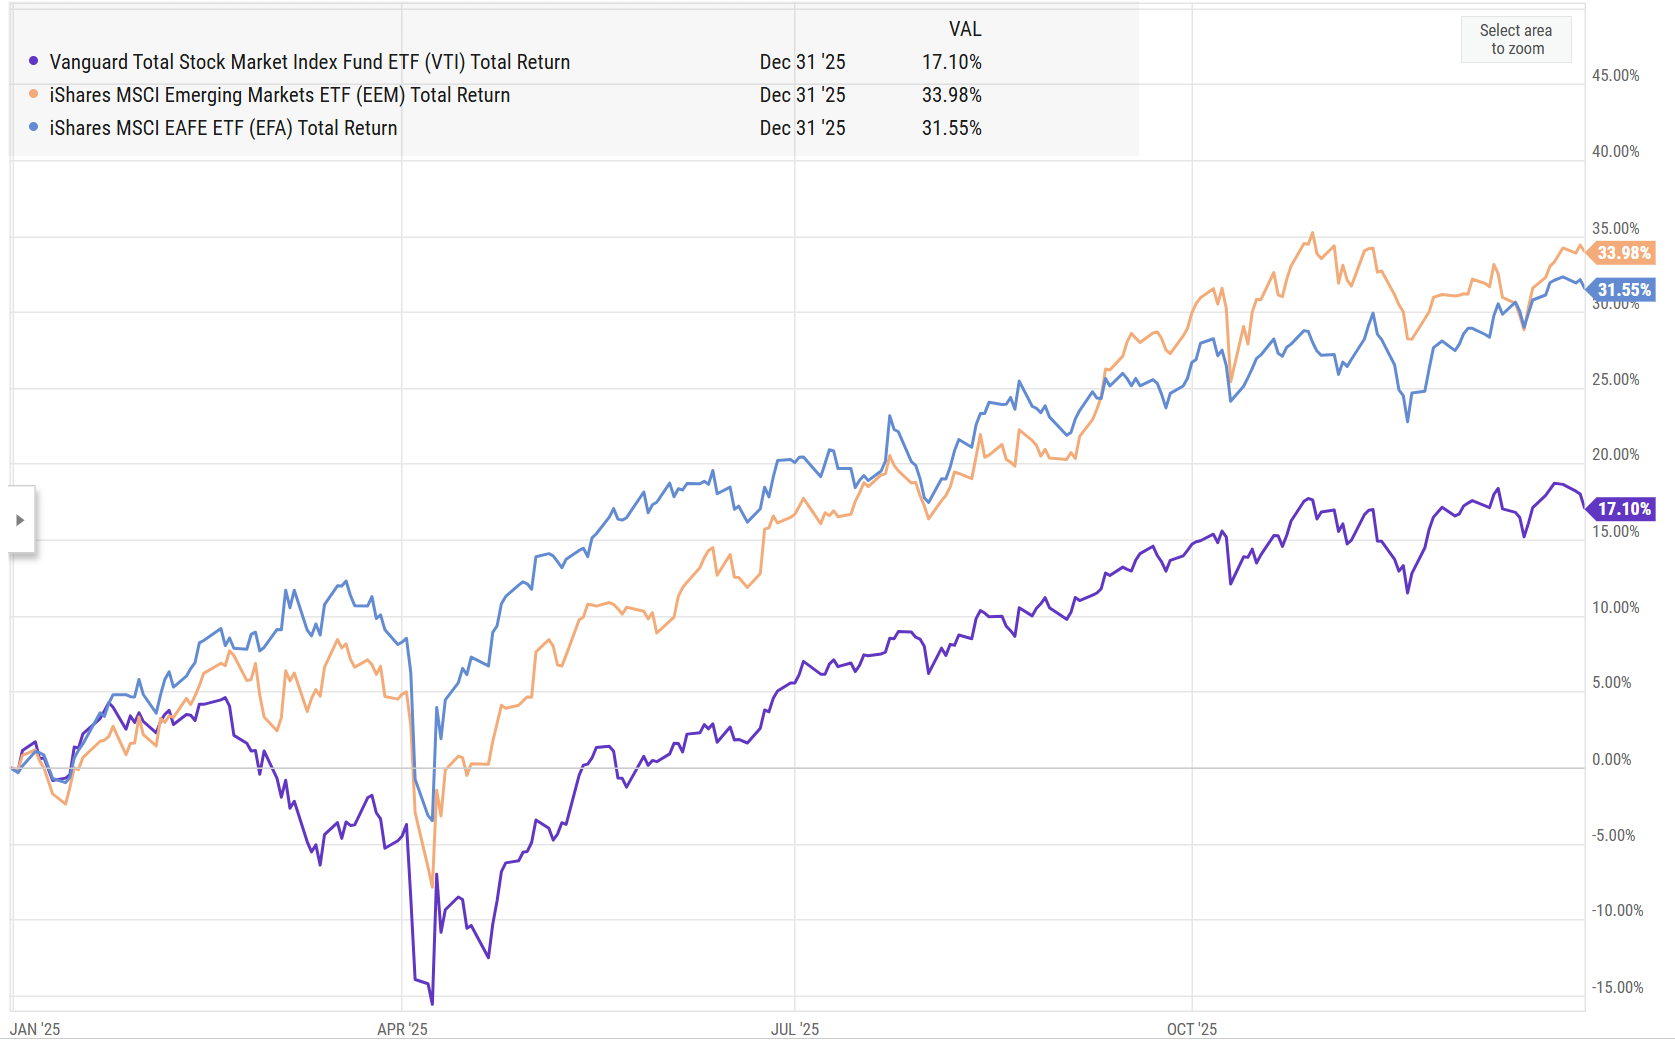
It was emerging markets(EM). The asset class allocators have been treating like the proverbial step child for the better part of five years. But.. read em and weep:
Since the March 30 bottom through May 6:
• Emerging Markets (EEM) +19.45%
• U.S. total market (VTI): +14.54%
• Europe & Foreign (EAFE): +8.47%
EM leading wasn’t on our bingo card. So we started digging. First question: what the heck happened to MEGA?
The MEGA Setup
Rewind to early 2025. From roughly January through April, “Make Europe Great Again” was the trade. Every macro podcast had the obligatory “is this Europe’s moment?” episode. Every sell-side desk had a slide deck with the German flag on the cover. The case wasn’t dumb:
- Germany broke its own fiscal rules. In March 2025, incoming Chancellor Merz pushed through changes to the country’s constitutional debt brake, unlocking a 500 billion-euro ($544 billion) borrowing-financed fund for infrastructure over 12 years, plus exempting defense and security spending above 1% of GDP from the debt rules entirely. After decades of German fiscal discipline — a country that historically treated deficit spending the way vampires treat sunlight — this was a real regime shift. Deutsche Bank Research called it “a large step towards implementing the fiscal regime shift that it initiated with the historic reform of the debt brake.”
- NATO defense spending pressure. The Trump administration was leaning on allies hard, and the trajectory was clear well before the formal agreement landed. NATO eventually agreed to more than double the spending target from 2% of GDP to 5% by 2035, with at least 3.5% on “pure” defense and the rest on security-related infrastructure. European defense names had a real bid for the first time in, oh, ever.
- Valuations. J.P. Morgan put Europe ex-UK at around 16x forward earnings versus 23x in the U.S. WisdomTree had the MSCI EMU at 14x versus 22x for the S&P 500. Same earnings stream, materially cheaper price. Costco aisle, basically.
Goldman, Deutsche Bank, and most of the sell side were on board. And while it stopped being a headline all the time, MEGA actually delivered. Cue high-fives, “Europe is back” think pieces, the works.
Past performance is not indicative of future results.
But… the Iran conflict in early 2026 was the second shoe. Europe imports most of its energy, and the math is unfriendly when oil moves the wrong way. The European Central Bank warned that a prolonged conflict could trigger stagflation and push major energy-dependent economies, including Germany and Italy, into technical recession by the end of 2026. The DAX stalled. EAFE cooled. The euro softened. MEGA didn’t blow up — it’s just keeping up now, versus outperforming.
Meanwhile, somewhere east of all this, that yellow line (EEM) on the chart above wasn’t done… it was just getting started.
Why EM Kept Going
Short answer, it’s a sort of Gold+AI proxy, hitting the weak US Dollar and AI “picks and shovels” themes together, higher Oil be damned.
- Weak dollar. The dollar has been rolling over, which is historically one of the most reliable EM tailwinds in the macro playbook. The U.S. Dollar Index is down 11% over the past year and more than 2% so far in 2026. The pattern is almost comically consistent: in 2025, when the dollar fell 9%, EM stocks (VWO) rose 25.6% versus the S&P 500’s 17.7%. Weak dollar → EM works. It’s not a theory, it’s a sundial.
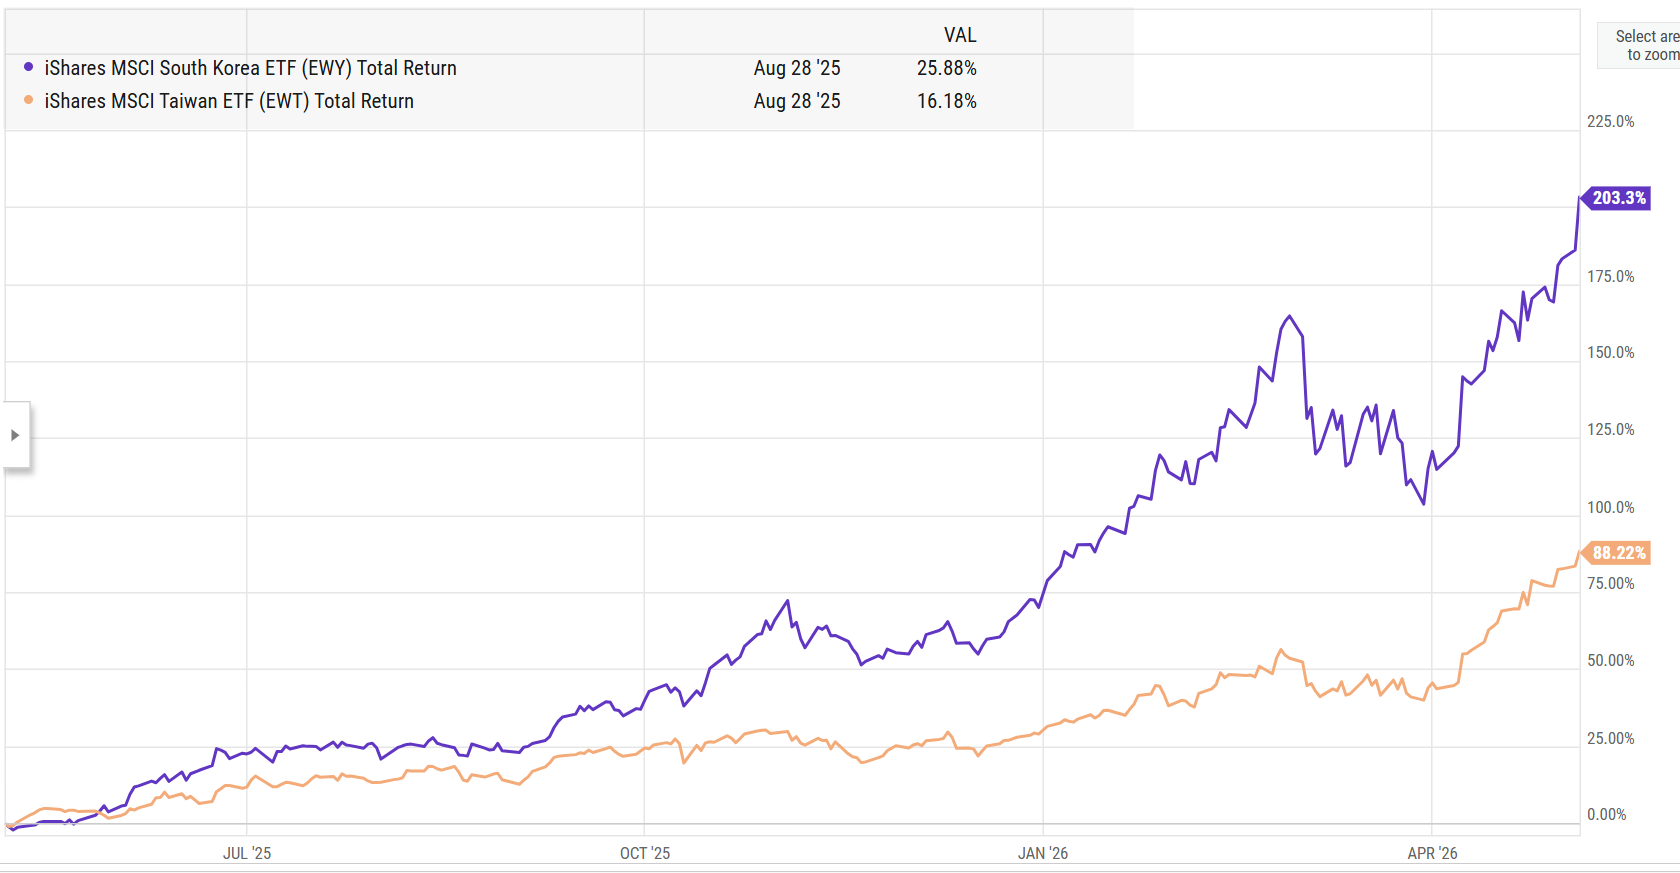
- AI semis. This is the big one. Taiwan and Korea sit at the absolute center of the AI hardware supply chain. The Taiwanese economy has remained robust, supported by strong demand tied to artificial intelligence, despite lingering risks from the Middle East conflict.
That last one shows up in the country ETFs in a way that’s hard to ignore: Korea roughly doubling since the Mar 30 lows, with TSMC, Samsung, and SK Hynix doing the heavy lifting. And growing 250% since Jan 2025 when we were talking MEGA. These aren’t peripheral EM names — these are the picks and shovels of the AI gold rush, and they happen to live inside an index ticker most U.S. allocators don’t even open the brochure on.
Past performance is not indicative of future results.
But what do we call it? If MEGA is out, maybe SEGA is in. Make Seoul (and Emerging) Great Again. Sonic the Hedgehog over Euro Mickey Mouse. We’ll workshop it.
The Diversification Problem
Here’s the part worth sitting with — the part that should make most allocators a little uncomfortable. If we look at the five years leading into 2025:
• VTI: +91.05%
• EAFE: +25.87%
• EM: +4.02%
Five years of basically nothing in EM while U.S. stocks nearly doubled. Half a decade. If you were the EM evangelist in your investment committee, you were also the person who didn’t get invited to the offsite.
So who was actually overweight EM coming into 2025? Realistically? Nobody. Two camps, and they’re both the people you’d find at the weird table in the cafeteria, and on our podcast.
- Trend followers. Their systems don’t care about the prior decade. If EM starts trending, they allocate. No therapy session about whether EM “deserves” the move, no committee meeting, no strategist note. NO emotions. Trend up, position on. Done.
- The Cockroach — the approach laid out at mutinyfund.com is the canonical example. As they put it: “The Cockroach Approach is our answer. It is a way of approaching building a diversified portfolio with the goal of compounding wealth effectively over decades without needing to predict macroeconomic events.” It’s designed to hold something that works in every regime, including the regimes that have been quiet for years. Boring? Yes. Effective? Also yes.
Everyone else was fighting home country bias (the very human urge to overweight the country your mailing address is in) and recency bias (the equally human urge to assume what just happened will keep happening forever). Both pointed the same direction: stay in U.S. equities. For five years, that was correct. Heck, for the five before that and the five before that. But for the last 17 months, though:
• EM: +60.15%
• EAFE: +39.78%
• VTI: +25.08%
(January 2025 through May 5th, 2026.)
This is the uncomfortable part of real diversification — the kind we bang on about constantly around here. The positions that look like dead weight for years are often the exact ones that carry the portfolio when the regime shifts. Knowing that intellectually and actually holding through five years of EM doing nothing while QQQ-only portfolios compound at 20% are two completely different sports. One is golf. The other is a cage match.
The Open Question
So is this the start of a longer non-U.S. run, or just a cyclical pop inside a longer U.S.-led regime? Honest answer: who knows?. EM has done this dance before — 2017 looked like the turn, and it absolutely was not.
But the setup is interesting. If the dollar keeps weakening, if AI hardware demand holds, and if China keeps stimulating, the factors driving EM aren’t one-week phenomena. They’re structural.
Taking that bet, that Europe and Emerging are on the upswing; our friends over a Return Stacked recently launched their newest stacked product, International Equities plus Managed Futures
The contrarian in us would probably use the new ETF product stream as a ‘tell’ If you see some 2x emerging, or Trend + EM products launching – the cat is waaay out of the bag.
In the meantime, the chart is the chart. U.S. exceptionalism isn’t dead. But for the first time in a while, it’s got company at the top of the leaderboard — and that company speaks Mandarin, Korean, and Portuguese.
Sources
- NPR — Germany approves huge defense and infrastructure spending plan
- Deutsche Bank flow — Germany update: breaking from the brake
- CNBC — NATO allies agree to higher 5% defense spending target
- J.P. Morgan Asset Management — Global ex-US equities outlook
- WisdomTree — Investors Are Rethinking U.S. Exceptionalism
- Wikipedia — Economic impact of the 2026 Iran war
- Crescent PW — March 2026 Market Report: The Iran War
- The Motley Fool — A Weakening Dollar Is Sending This Group of Stocks Sharply Higher
- Stock Analysis — EWT ETF Overview
- iShares — EWT fund page
- Yahoo Finance — EWY quote
- Mutiny Fund — The Cockroach Approach Whitepaper
- Acquirer’s Multiple — Jason Buck on the Cockroach Portfolio


