December 31, 2014
Attain Capital
Like
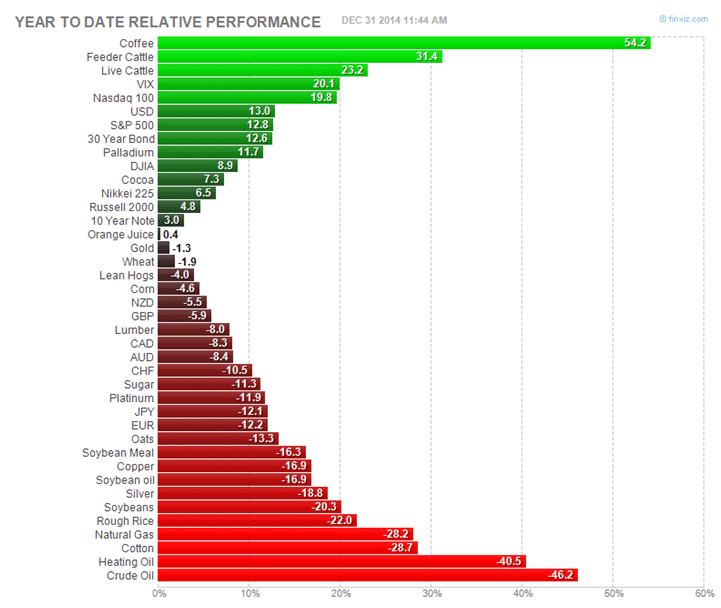
This year was anything but boring in the futures markets. There were plenty of major moves in multiple markets, and it seems just about every market not at 5 year highs (stocks, the US Dollar, and cattle) was at 5 year lows (Crude, Copper, Yen). That’s in stark contrast to the past few years, where there’s been more markets up than down. But it was two black liquids stealing the headlines – with Coffee leading the way on the upside, and Crude Oil the big loser on the downside. All those who had the Long Coffee/Short Oil trade on, take a bow – that’s a winner! (What could we call that – the Texas Latte, the Beans over Barrel spread?)
[Please note – Finviz does some weird things around contract rolls, which can make their percentage gains over longer periods different than what would be found using a continuous contract or the cash/spot market, nonetheless, we feel it is representative of each market’s 2013 movements]:
(Disclaimer: Past performance is not necessarily indicative of future results)
Chart Courtesy: Finviz
- It was a mostly down year, with 63% of markets down; compared with 51% up in ‘13, 80% up in ‘12, and 85% up in 2010
- While it seemed more volatile this year, just 15 markets finished up or down more than 15% (compared with 16 last year).
- Having said that – VIX futures finished about 20% higher than where they started the year, despite stocks at all time highs (curious)
- US Stocks & US Bonds turned in near identical performances in 2014, both up around 12%. Not every day you see that.
- Commodity markets were routed. Crude made the headlines, but Cotton, Soybeans, Rice, Oats, Platinum, Sugar and more were all down double digits.
- Gold, for all the headlines, was basically unchanged
- Currencies were in play, for the first time in what seems like forever, with the USD making a very sneaky move up to multi year highs; the Japanese Yen and Canadian Dollar hitting 5 year lows, and the Euro, Aussie, and Swiss testing multi-year lows.
- The headliner Coffee was up impressively, but despite being up around 50%, it’s still about 50% below its 2011 highs (needs to rise 100% or so to get there)
- Many markets are at 5 year lows, including: energy futures (Crude, Heating, Gasoline), many metals (Silver, Platinum, & Copper), currencies (Jap Yen and Canadian Dollar), and a few random like Cotton,
- Wheat & Corn – Despite being some of the most volatile futures markets, you wouldn’t know it by this chart, down only (-1.9% and 4.7%) this year
So what will 2015 bring? A big rebound in Oil prices (a rise back to $80/barrel would be a gain of about 60%)? The much expected sell off in US treasuries? A commodity rebound in metals, softs, and grains? None of the above?
Luckily, professional managers don’t need to know the answers in order to have a successful 2015. They just need to be able to identify and capture any such moves when they happen (no small task, to be sure; as we’ve seen in recent years….but more than a few will be up to the task).
Happy New Year!
Disclaimer
The performance data displayed herein is compiled from various sources, including BarclayHedge, and reports directly from the advisors. These performance figures should not be relied on independent of the individual advisor's disclosure document, which has important information regarding the method of calculation used, whether or not the performance includes proprietary results, and other important footnotes on the advisor's track record.
The programs listed here are a sub-set of the full list of programs able to be accessed by subscribing to the database and reflect programs we currently work with and/or are more familiar with.
Benchmark index performance is for the constituents of that index only, and does not represent the entire universe of possible investments within that asset class. And further, that there can be limitations and biases to indices such as survivorship, self reporting, and instant history. Individuals cannot invest in the index itself, and actual rates of return may be significantly different and more volatile than those of the index.
Managed futures accounts can subject to substantial charges for management and advisory fees. The numbers within this website include all such fees, but it may be necessary for those accounts that are subject to these charges to make substantial trading profits in the future to avoid depletion or exhaustion of their assets.
Investors interested in investing with a managed futures program (excepting those programs which are offered exclusively to qualified eligible persons as that term is defined by CFTC regulation 4.7) will be required to receive and sign off on a disclosure document in compliance with certain CFT rules The disclosure documents contains a complete description of the principal risk factors and each fee to be charged to your account by the CTA, as well as the composite performance of accounts under the CTA's management over at least the most recent five years. Investor interested in investing in any of the programs on this website are urged to carefully read these disclosure documents, including, but not limited to the performance information, before investing in any such programs.
Those investors who are qualified eligible persons as that term is defined by CFTC regulation 4.7 and interested in investing in a program exempt from having to provide a disclosure document and considered by the regulations to be sophisticated enough to understand the risks and be able to interpret the accuracy and completeness of any performance information on their own.
RCM receives a portion of the commodity brokerage commissions you pay in connection with your futures trading and/or a portion of the interest income (if any) earned on an account's assets. The listed manager may also pay RCM a portion of the fees they receive from accounts introduced to them by RCM.
Limitations on RCM Quintile + Star Rankings
The Quintile Rankings and RCM Star Rankings shown here are provided for informational purposes only. RCM does not guarantee the accuracy, timeliness or completeness of this information. The ranking methodology is proprietary and the results have not been audited or verified by an independent third party. Some CTAs may employ trading programs or strategies that are riskier than others. CTAs may manage customer accounts differently than their model results shown or make different trades in actual customer accounts versus their own accounts. Different CTAs are subject to different market conditions and risks that can significantly impact actual results. RCM and its affiliates receive compensation from some of the rated CTAs. Investors should perform their own due diligence before investing with any CTA. This ranking information should not be the sole basis for any investment decision.
See the full terms of use and risk disclaimer here.
January 4, 2015
Sugar Price
50-year in the picture:
https://andremonk.com/2014/12/sugar-price-1964-2014/