Will La Nina Push Commodities Lower After El Nino?

If you haven’t heard, we’re in the midst of the strongest El Nino in history, and while it might be a chilly 33 degrees in Chicago, the planet just recorded its warmest land and sea temperatures ever:

A while back, we covered El Nino and what it could mean for commodities, but we may need to start concerning ourselves with another weather phenomena that typically follows El Nino, called La Nina (supposedly the Spanish flavor is due to fisherman naming the phenonemons off predominantly Spanish speaking South America). So what is La Nina?  Essentially, it’s the exact opposite of El Nino, where the Pacific Ocean near the equator experiences cooler than usual temperatures, causing this effect on the United States weather pattern, via the weather channel.Updated La Nina

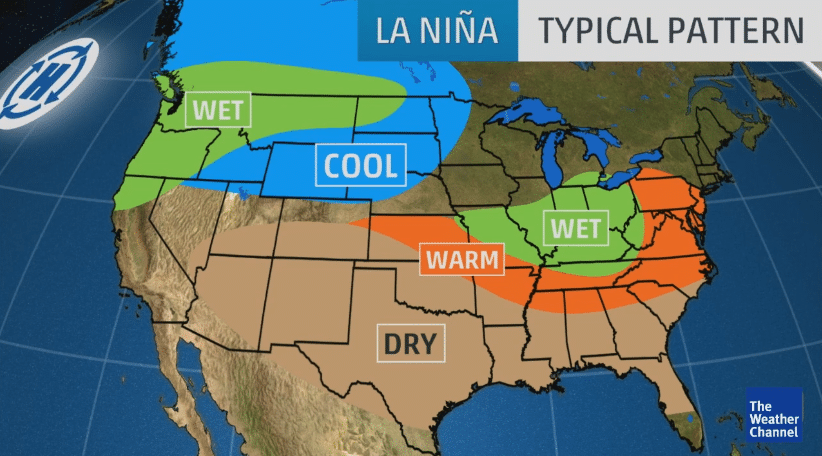
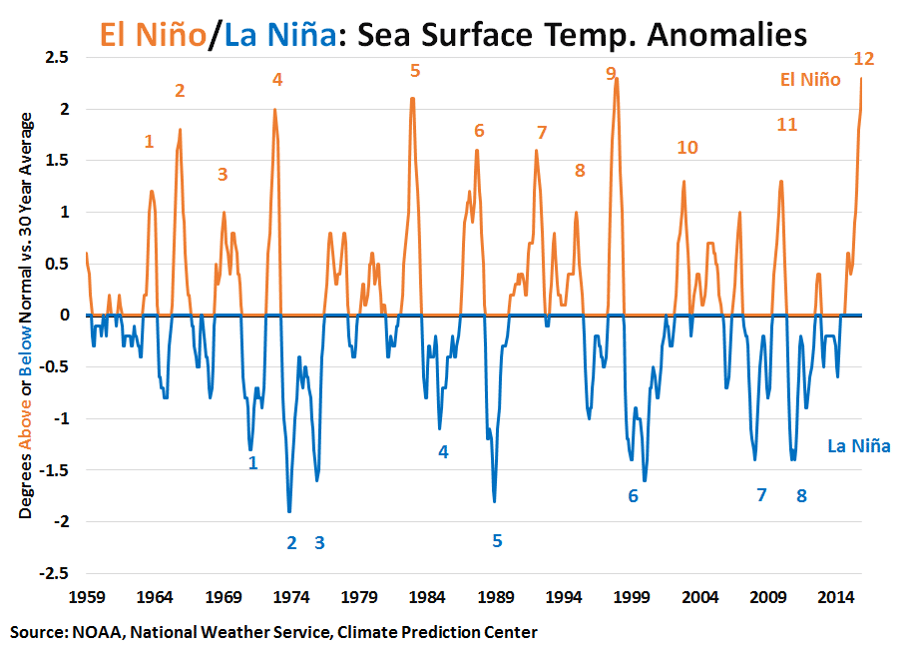
But it’s not just that this weather phenomena follows El Nino, it’s that the more extreme the El Nino, the more extreme possible response from La Nina, via a chart by Erik Norland, Senior Economist of CME Group.

El Nino La Nina

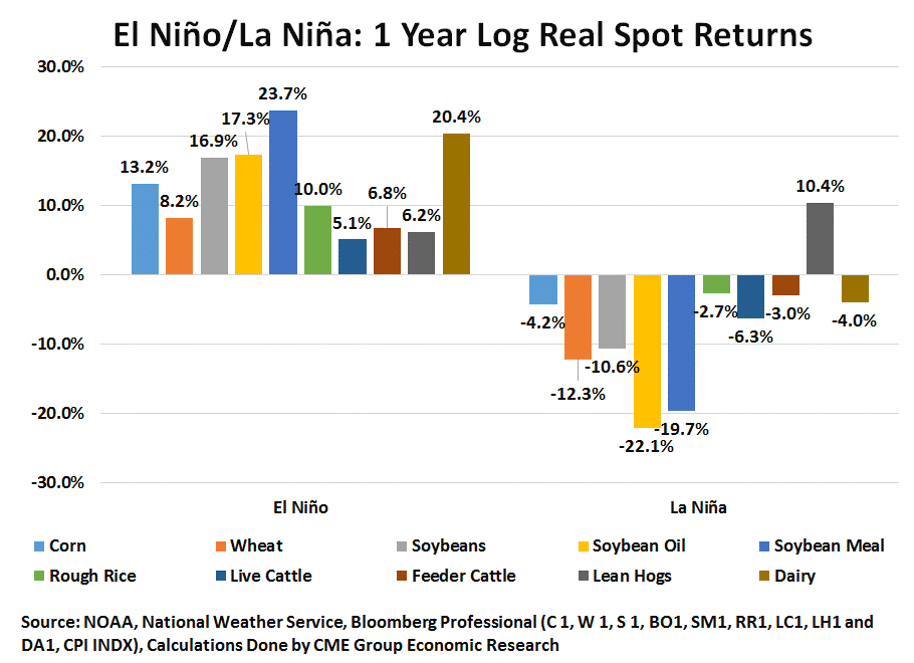
So who cares besides Jim Cantore and weather geeks?  Well, anyone who grows a crop in the US, or trades those crops (affectionately called AG markets, after agriculture) in the futures markets, for starters. Using data from the NOAA, the CME Group looked at spot and rolled (reinvested) AG futures market returns in the 12 and 24 months after temperatures rose by one degree above normal (El Nino) or fell by one percent (La Nina) from 1959 to present. Turns out… the shifting weather seem to play a role with AG prices rising during El Nino and falling during La Nina.

El Nino La Nina 1 Year Later

El Nino Effect

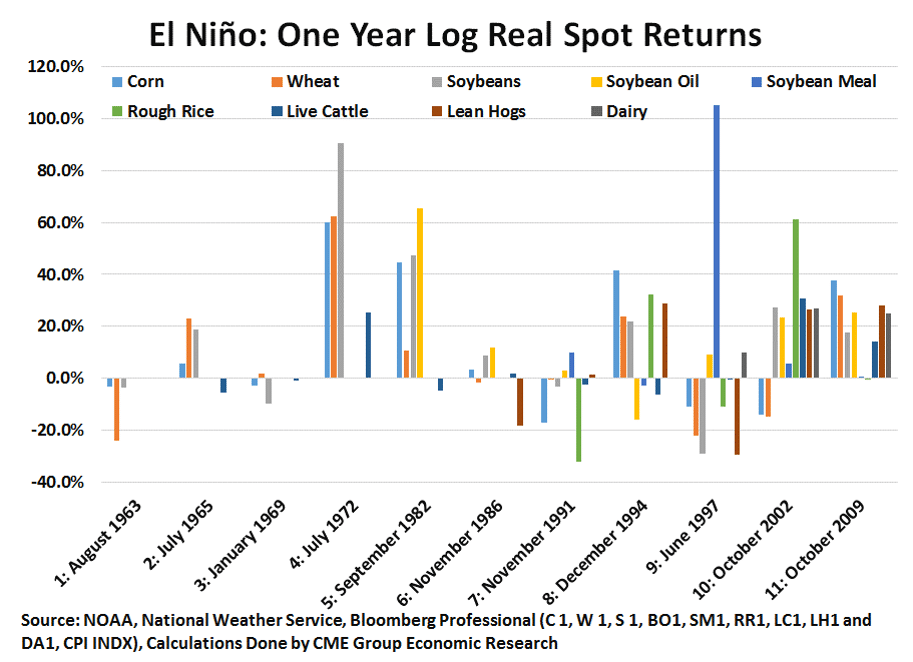
Scanning the data above, we would expect Ag prices to be higher during this record El Nino… but we’re only a couple months into El Nino, and it’s hard to say if the grain and meat markets are going to have the same response as it has on average over the past 60 years. We are the first people that will tell you that past performance is not necessarily indicative of future results, and so far grains and meats are unexpectedly down since El Nino has started. But this wouldn’t be the first time that El Nino didn’t have an effect on commodity prices. Take a look at each market move during each El Nino dating back to 1963 and you can see more than a few down bars.  But given that this is the strongest El Nino on record, the lack of corresponding moves in the Ag markets are a bit puzzling, with sympathy sell offs in energy markets perhaps the culprit.

El Nino 1 Year Later

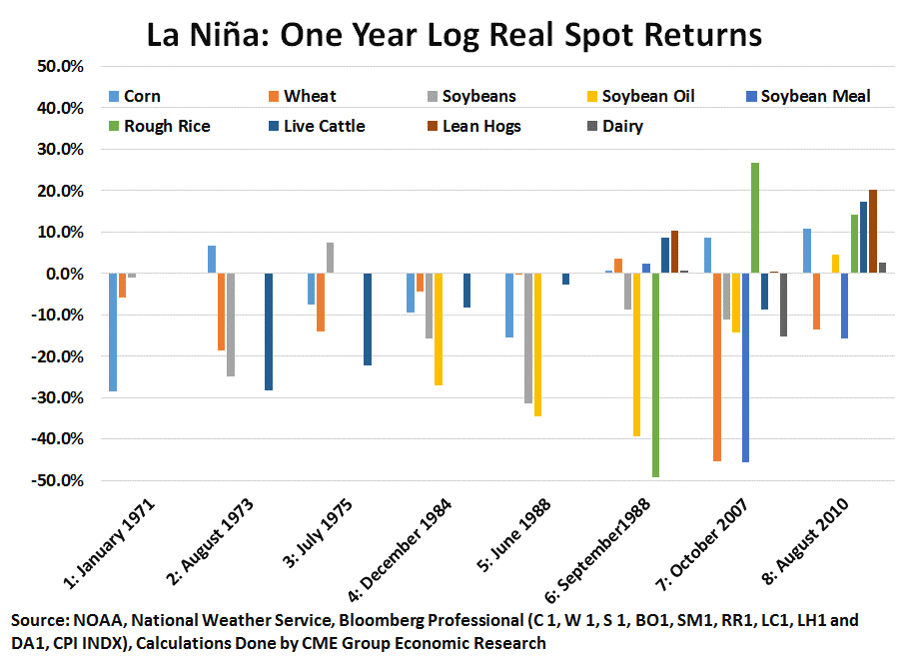
In the meantime… What about La Nina?

With La Nina the opposite phenomenon of El Nino, we would expect the opposite market behavior – and that is exactly what is seen when looking across the same swath of markets, with everything mostly down across the La Nina’s, and just a few bars higher. It is interesting to note that the recent La Nina’s have seen more market moves up than in the past, however.

La Nina 1 Year Later

Takeaway:

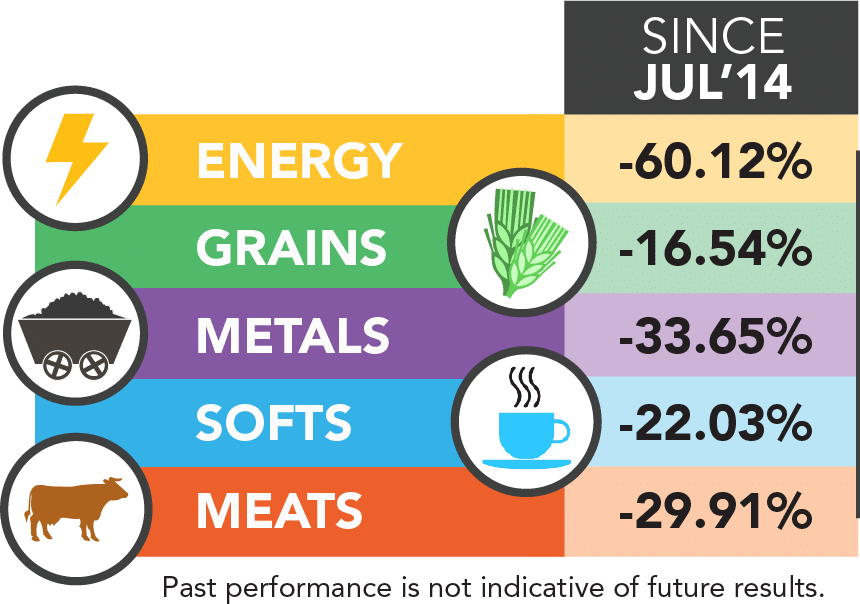
Commodities have consistently been moving downward over the past 18 months, but it’s actually interesting to note that grains have seen the smallest decline when compared to the rest of the sectors. Perhaps that is the El Nino effect offsetting the commodity sector sell off somewhat?

(Performance as of 1/29/16)

Futures Sector PerformanceEnergy = WTI, Brent, Heating Oil, Gas RBOB Gas, Natural Gas, and Ethanol
Grains = Wheat, Corn, Soybeans, Soybean Oil, Canola Oil
Metals = Gold, Silver, Copper, Platinium, Palladium
Softs = Cotton, Orange Juice, Coffee, Sugar, Cocoa, Lumber
Meats Live Cattle, Feeder Cattle, and Live Hogs

And now what?  If prices are supposed to go up in El Nino years but they’ve gone down… if they’re supposed to go down in La Nina years, will they now go up?  Will Bizzaro world continue to hold steady?  Or will La Nina assert itself on the downside with grain markets ‘catching up’ to energies and the rest with substantial sell offs. Only time will tell, so we’ll leave it to the professional Agriculture traders to find the highs, lows, and possible return drivers in these markets. You can request a list of Agriculture traders we consistently track here.

Write a Comment

Disclaimer
The performance data displayed herein is compiled from various sources, including BarclayHedge, and reports directly from the advisors. These performance figures should not be relied on independent of the individual advisor's disclosure document, which has important information regarding the method of calculation used, whether or not the performance includes proprietary results, and other important footnotes on the advisor's track record.

The programs listed here are a sub-set of the full list of programs able to be accessed by subscribing to the database and reflect programs we currently work with and/or are more familiar with.

Benchmark index performance is for the constituents of that index only, and does not represent the entire universe of possible investments within that asset class. And further, that there can be limitations and biases to indices such as survivorship, self reporting, and instant history. Individuals cannot invest in the index itself, and actual rates of return may be significantly different and more volatile than those of the index.

Managed futures accounts can subject to substantial charges for management and advisory fees. The numbers within this website include all such fees, but it may be necessary for those accounts that are subject to these charges to make substantial trading profits in the future to avoid depletion or exhaustion of their assets.

Investors interested in investing with a managed futures program (excepting those programs which are offered exclusively to qualified eligible persons as that term is defined by CFTC regulation 4.7) will be required to receive and sign off on a disclosure document in compliance with certain CFT rules The disclosure documents contains a complete description of the principal risk factors and each fee to be charged to your account by the CTA, as well as the composite performance of accounts under the CTA's management over at least the most recent five years. Investor interested in investing in any of the programs on this website are urged to carefully read these disclosure documents, including, but not limited to the performance information, before investing in any such programs.

Those investors who are qualified eligible persons as that term is defined by CFTC regulation 4.7 and interested in investing in a program exempt from having to provide a disclosure document and considered by the regulations to be sophisticated enough to understand the risks and be able to interpret the accuracy and completeness of any performance information on their own.

RCM receives a portion of the commodity brokerage commissions you pay in connection with your futures trading and/or a portion of the interest income (if any) earned on an account's assets. The listed manager may also pay RCM a portion of the fees they receive from accounts introduced to them by RCM.

Limitations on RCM Quintile + Star Rankings

The Quintile Rankings and RCM Star Rankings shown here are provided for informational purposes only. RCM does not guarantee the accuracy, timeliness or completeness of this information. The ranking methodology is proprietary and the results have not been audited or verified by an independent third party. Some CTAs may employ trading programs or strategies that are riskier than others. CTAs may manage customer accounts differently than their model results shown or make different trades in actual customer accounts versus their own accounts. Different CTAs are subject to different market conditions and risks that can significantly impact actual results. RCM and its affiliates receive compensation from some of the rated CTAs. Investors should perform their own due diligence before investing with any CTA. This ranking information should not be the sole basis for any investment decision.

See the full terms of use and risk disclaimer here.

logo