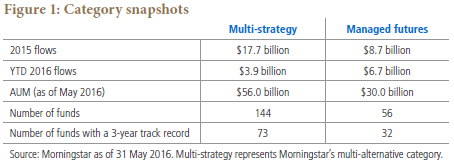
Alternative Investments are becoming more and more the place investors turn to find diversification for their portfolios. Look no further than a recent PIMCO piece showing Morningstar data from the start of 2015 to May 2016, where managed Futures and multi-strategy mutual funds saw roughly $37 Billion flow into the space.
Of course, these Morningstar categories are very broad, covering a lot of stuff we might not even put into the Alternatives bucket, but that’s for another post (in fact, that’s covered in this whitepaper – check it out: “Why Alternatives.”)
And understanding exactly what you’re getting in the Alternatives space is as important as ever. Take for example, this chart from PIMCO’s piece, showing the Managed Futures and Multi-Strategy categories broken down by their equity beta. If need a quick refresher, beta measures how much an investment moves when the stock market moves. A beta of 1.00 means they’ll have about the same volatility, while greater than 1 means more volatile, and less than 1 less volatility. Less than zero means you’ll have more or less volatility depending on the reading but in the opposite direction. Suffice to say a true diversifier should have a very low, if not negative, beta measurement – so that it isn’t moving in tandem with stocks.
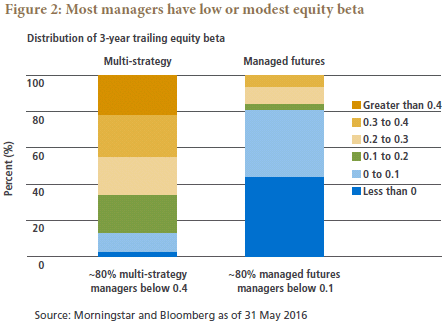
While Pimco felt both categories are doing a good job of diversifying, with both having more than 80% of their funds with betas less than 0.4 – we were a little more interested in how 80% of managed futures has an equity beta of less than 0.1! And nearly half with negative betas. To us, this doesn’t show how both categories are good diversifiers, it shows how managed futures is a great diversifier.
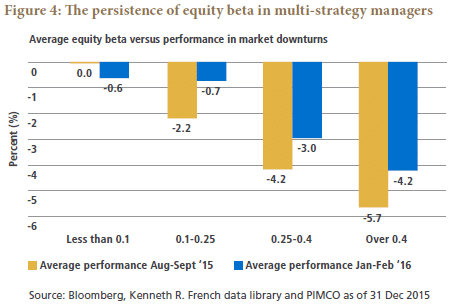
Finally, they finish with some analysis of each category during two recent sell off periods (Aug-Sep 2015 and Jan-Feb 2016). Our takeaway here, again, is that multi-strategy is more equity-like then many would probably assume, losing money right along stocks in both periods, no matter their equity beta.
In contrast, Managed Futures mutual funds were up between 2% and 7% during the Jan-Feb stock market downturn across all of their beta ranges; while between up +1% and down -5% in the earlier down market.
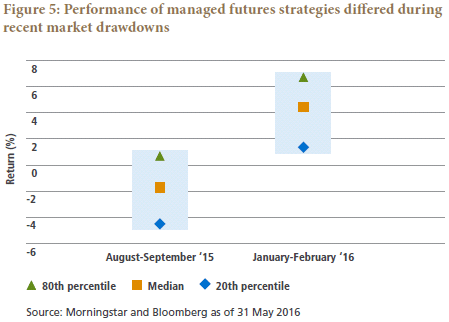
The lesson here is that non correlation does not equal negative correlation. Many expect their non-correlated investment to go up while stocks go down – but that won’t always be the case. Non correlated means they’ll do different things, on average! That means one time down, one time up, one time sideways during down markets, and so on – to average out as totally different performance during market downturns. Any one down period, and especially very short ones such as the two listed here, may result in performance you didn’t see coming. That mismatch with your expectations can be particularly exasperated if in a high beta multi-strategy fund which will act way more like the general stock market than their name would entail.
P.S. – Looking for a managed futures mutual fund? Check out the following:
AlphaCentric IMFC Managed Futures Strategy Fund
Catalyst Auctos Multi-Strategy Fund
Disclaimer
The performance data displayed herein is compiled from various sources, including BarclayHedge, and reports directly from the advisors. These performance figures should not be relied on independent of the individual advisor's disclosure document, which has important information regarding the method of calculation used, whether or not the performance includes proprietary results, and other important footnotes on the advisor's track record.
The programs listed here are a sub-set of the full list of programs able to be accessed by subscribing to the database and reflect programs we currently work with and/or are more familiar with.
Benchmark index performance is for the constituents of that index only, and does not represent the entire universe of possible investments within that asset class. And further, that there can be limitations and biases to indices such as survivorship, self reporting, and instant history. Individuals cannot invest in the index itself, and actual rates of return may be significantly different and more volatile than those of the index.
Managed futures accounts can subject to substantial charges for management and advisory fees. The numbers within this website include all such fees, but it may be necessary for those accounts that are subject to these charges to make substantial trading profits in the future to avoid depletion or exhaustion of their assets.
Investors interested in investing with a managed futures program (excepting those programs which are offered exclusively to qualified eligible persons as that term is defined by CFTC regulation 4.7) will be required to receive and sign off on a disclosure document in compliance with certain CFT rules The disclosure documents contains a complete description of the principal risk factors and each fee to be charged to your account by the CTA, as well as the composite performance of accounts under the CTA's management over at least the most recent five years. Investor interested in investing in any of the programs on this website are urged to carefully read these disclosure documents, including, but not limited to the performance information, before investing in any such programs.
Those investors who are qualified eligible persons as that term is defined by CFTC regulation 4.7 and interested in investing in a program exempt from having to provide a disclosure document and considered by the regulations to be sophisticated enough to understand the risks and be able to interpret the accuracy and completeness of any performance information on their own.
RCM receives a portion of the commodity brokerage commissions you pay in connection with your futures trading and/or a portion of the interest income (if any) earned on an account's assets. The listed manager may also pay RCM a portion of the fees they receive from accounts introduced to them by RCM.
Limitations on RCM Quintile + Star Rankings
The Quintile Rankings and RCM Star Rankings shown here are provided for informational purposes only. RCM does not guarantee the accuracy, timeliness or completeness of this information. The ranking methodology is proprietary and the results have not been audited or verified by an independent third party. Some CTAs may employ trading programs or strategies that are riskier than others. CTAs may manage customer accounts differently than their model results shown or make different trades in actual customer accounts versus their own accounts. Different CTAs are subject to different market conditions and risks that can significantly impact actual results. RCM and its affiliates receive compensation from some of the rated CTAs. Investors should perform their own due diligence before investing with any CTA. This ranking information should not be the sole basis for any investment decision.
See the full terms of use and risk disclaimer here.