October 31, 2016
The Alts Team
1 Like
It’s been just over a year since everyone’s favorite yield-producing asset class, MLPs, took a nose dive following energy prices off the proverbial cliff. A year after we “Looked Under the MLP Hood”, it’s high time we circled back to see what’s going on in the oil services patch. Here’s an overview of where MLPs had been, went, and are now:
(Disclaimer: Past performance is not necessarily indicative of future results)
Source: Alerian
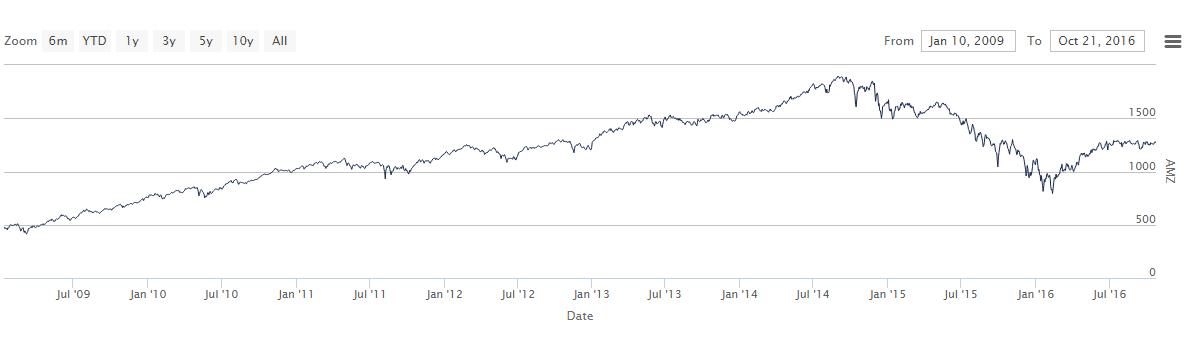
From its 2014 highs to the resulting valley in 2015, the MLP index’s lowest point was down -58.07%. How have they fared with oil bouncing back some – how about still down -35% from the highs. {past performance is not necessarily indicative of future results}. That’s a lot of 7% annual yields needed to just break even.
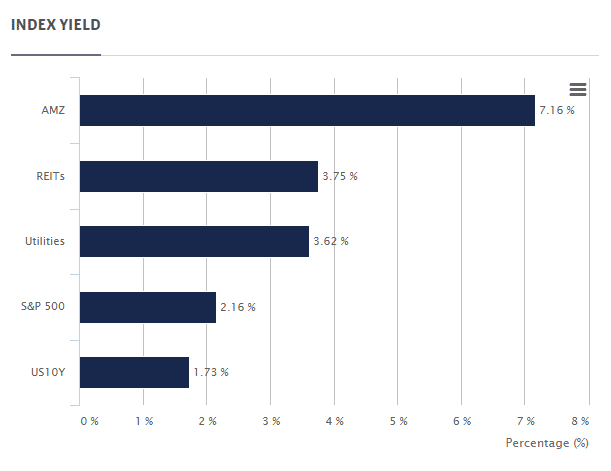
If you don’t know what an MLP is, check out our post here, or check out Alerian’s masterful infographic. From a 10,000 foot overview, the reason there’s $490 Billion in total market capitalization of MLPs is because of the high yields they are able to provide to investors. For example, check out how much yield Alerian produces compared to the S&P or REITS.

Basically – the sell was/is – buy these MLP things, and you’ll yield 6% to 8% a year and get all the upside from the energy sector. That’s all well and fine if there is an upside to the energy sector. It can be quite painful when that upside suddenly disappears. If your one trick pony needs energy prices going up, it can be tough when energy prices don’t have a good track record the past two years. But energy prices have stabilized, risen dramatically from their lows. How have MLPs fared in comparison:

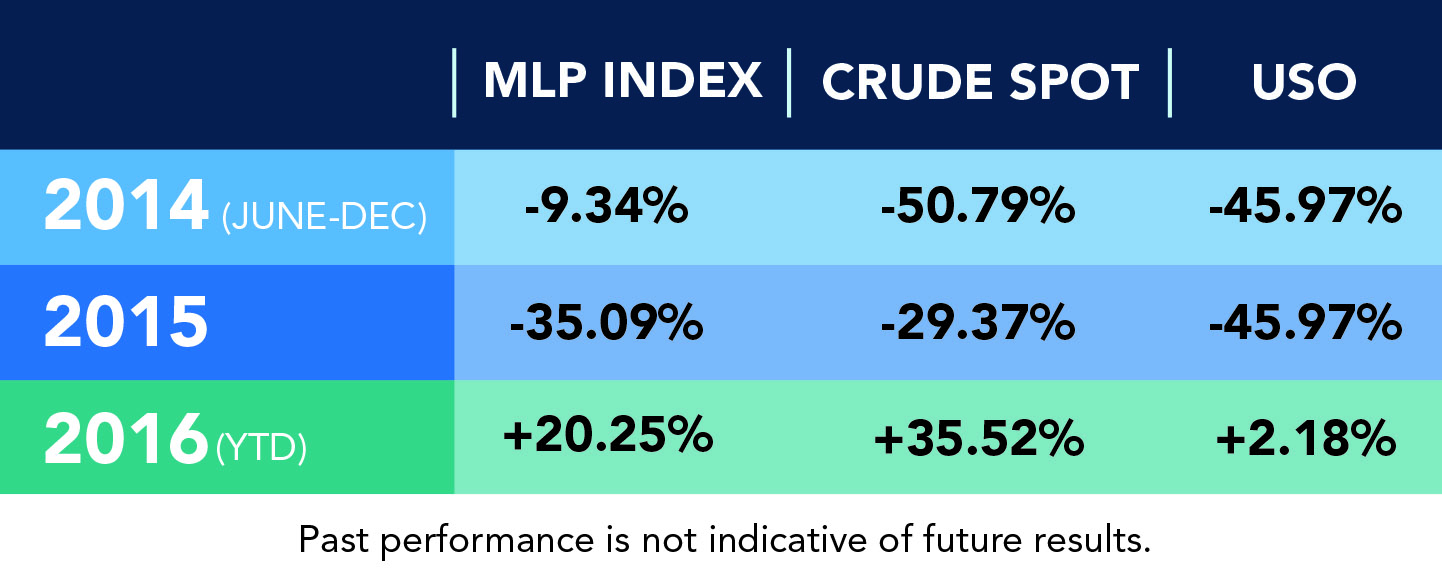
As you can see, MLPs saw a bit of a delay in their reaction to energy prices in 2014, as many of them are toll collectors of sorts without direct exposure to energy prices. But as 2015 and 2016 showed when they became highly correlated to energy prices, that toll collector theory only goes so far, with investors realizing lower prices can mean lower margins, lower demand for drilling and services, and all the rest. And we couldn’t help but take a shot here at $USO one more time , showing that it was the worst way to get exposure once again.
But no matter how you look at it; MLPs, Crude Spot, and the ETF $USO are still in drawdowns from the fall off in crude prices more than two years ago. Sure, it’s been a nice bounce in Crude Oil, along with MLPs have stabilized – but that’s a lot of yield payments to make up for still being down -20% to -30%. For our money, we’d rather have energy sector exposure via a long/short strategy which can capture both up and down moves.
Disclaimer
The performance data displayed herein is compiled from various sources, including BarclayHedge, and reports directly from the advisors. These performance figures should not be relied on independent of the individual advisor's disclosure document, which has important information regarding the method of calculation used, whether or not the performance includes proprietary results, and other important footnotes on the advisor's track record.
The programs listed here are a sub-set of the full list of programs able to be accessed by subscribing to the database and reflect programs we currently work with and/or are more familiar with.
Benchmark index performance is for the constituents of that index only, and does not represent the entire universe of possible investments within that asset class. And further, that there can be limitations and biases to indices such as survivorship, self reporting, and instant history. Individuals cannot invest in the index itself, and actual rates of return may be significantly different and more volatile than those of the index.
Managed futures accounts can subject to substantial charges for management and advisory fees. The numbers within this website include all such fees, but it may be necessary for those accounts that are subject to these charges to make substantial trading profits in the future to avoid depletion or exhaustion of their assets.
Investors interested in investing with a managed futures program (excepting those programs which are offered exclusively to qualified eligible persons as that term is defined by CFTC regulation 4.7) will be required to receive and sign off on a disclosure document in compliance with certain CFT rules The disclosure documents contains a complete description of the principal risk factors and each fee to be charged to your account by the CTA, as well as the composite performance of accounts under the CTA's management over at least the most recent five years. Investor interested in investing in any of the programs on this website are urged to carefully read these disclosure documents, including, but not limited to the performance information, before investing in any such programs.
Those investors who are qualified eligible persons as that term is defined by CFTC regulation 4.7 and interested in investing in a program exempt from having to provide a disclosure document and considered by the regulations to be sophisticated enough to understand the risks and be able to interpret the accuracy and completeness of any performance information on their own.
RCM receives a portion of the commodity brokerage commissions you pay in connection with your futures trading and/or a portion of the interest income (if any) earned on an account's assets. The listed manager may also pay RCM a portion of the fees they receive from accounts introduced to them by RCM.
Limitations on RCM Quintile + Star Rankings
The Quintile Rankings and RCM Star Rankings shown here are provided for informational purposes only. RCM does not guarantee the accuracy, timeliness or completeness of this information. The ranking methodology is proprietary and the results have not been audited or verified by an independent third party. Some CTAs may employ trading programs or strategies that are riskier than others. CTAs may manage customer accounts differently than their model results shown or make different trades in actual customer accounts versus their own accounts. Different CTAs are subject to different market conditions and risks that can significantly impact actual results. RCM and its affiliates receive compensation from some of the rated CTAs. Investors should perform their own due diligence before investing with any CTA. This ranking information should not be the sole basis for any investment decision.
See the full terms of use and risk disclaimer here.