
Han Solo famously discounted the math when telling C3PO off – trusting way more in his innate skills than cold, scientific, robotic numbers coming out of a walking/talking computer. (PS – we had a nice infographic on this back in the day), but we seem to be creeping more and more towards the computerized probability shaped world of the protocol droid, especially when it comes to everyone’s favorite mid-March pastime – the ubiquitous bracket pool.
How much do your trust probabilities? If you were to ask someone in Chicago the probability of no snow in Chicago during the month of January and February, they probably would have told you there’s a 0% chance. Well, for those living in Chicago, that actually happened for the first time in 150 years or so (must be Cubs related). Was it highly, highly unlikely? Yes. Improbable? Yes. But as impossible as a 1.00% chance of happening or 0.010% chance of happening makes most of us feel. Not so much. Therein lies the problem with probability. You could have taken every bit of data ever collected on Chicago weather patterns, and it would have been a safe assurance, that at least one moment in the winter, it would snow in Chicago. We take a 0.10% chance as near certainty of something not happening. Except it did happen.
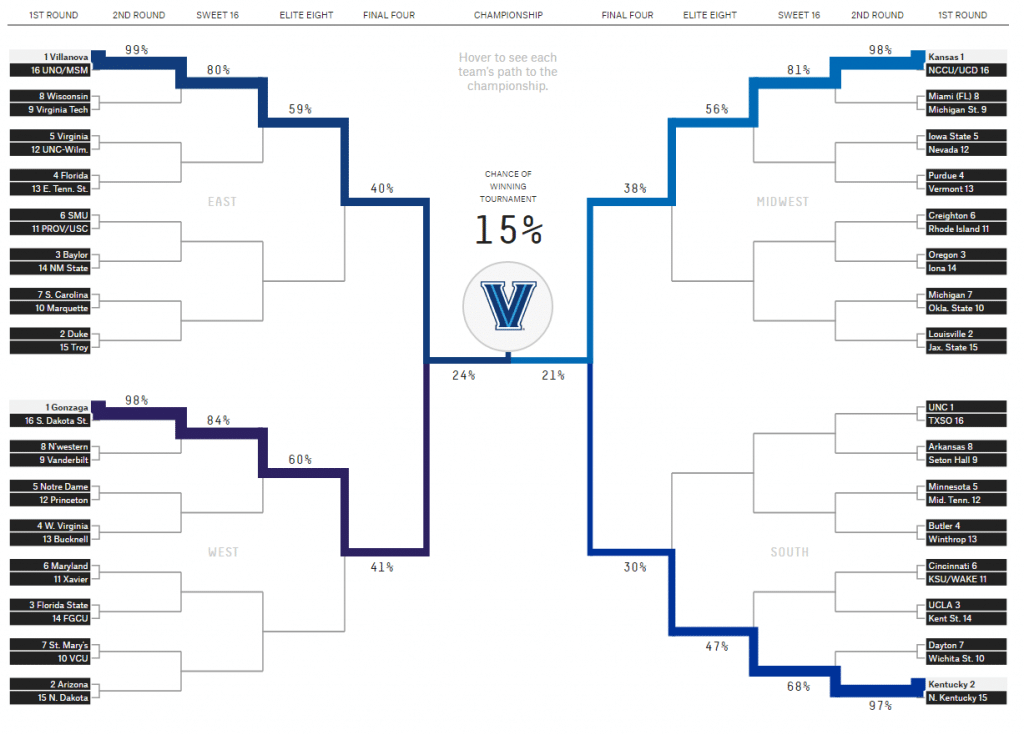
Back to March Madness and the proliferation of statistics to measure teams ‘odds’ of advancing through the bracket. The beloved data nerd Nate Silver and his FiveThirtyEight website are out with just these types of probabilities, diving into the depths of the march madness bracket like a Big Short guy analyzing mortgages. At the end of all their number crunching – a nice round number, like the overall number one seed Villanova having a 15% chance of winning the tournament (no word if that includes a penalty for having won it last year, which counter-intuitively makes it that much harder to do this year).
This isn’t FiveThirtyEight’s first go around with sports statistics; we highlighted our skepticism on their World Cup predictions back in 2014. These predictions are made based on what is called the Elo ratings (something FiveThirtyEight uses for all their sports predictions) as well as 5 other computer rankings. This accounts for strength of schedule, travel distance, injuries, strength of conference; the list goes on and on.
But the problem with all this data, never mind the six computing programs, is that it’s just past performance. They’re the odds of it happening IF everything that has happened in the past happened the same way again in the future. That’s a mighty big IF, and can help explain why just this sort of predictive odds were off in the US presidential election. FiveThirtyEight gave Hillary Clinton a 71% of winning on election day. That was obviously calculated from statistical data of registered voters, election turnout data based on weather, population sizes of counties, and people who actually get asked who they will vote for. You get “inside information,” in a way. You get to know how the players are going to play the game before the game is played. Nate Silver’s genius 4 years ago when correctly predicting Obama’s 2nd win was stripping out all the biases and noise in those polls and zeroing in on what the right “inside information” was. But genius or not, he can’t make 71% odds the same thing as a win. There was still a 29% probability of the opposite happening.
And now back to basketball. Analyzing the past performance of a basketball team, and their seed positions, and its players isn’t “inside information.” It’s past performance. And past performance has a nasty way of being a terrible indicator of future performance, especially when you get 12-13 different people on each team, crashing planes, human referees, lucky bounces, and all the rest. At the very least, that’s 22 degrees of freedom put into the mix. Add in what they ate the day before, how their feeling, whether they got in a fight with their significant other, how the guy their guarding smells, and all of the rest; you’re talking hundreds if not thousands of moving parts.
Why do we care? Because there’s a whole lot of prediction nonsense in the financial markets that is almost continuously wrong:
– Stock price targets
– End of year Dow or S&P targets
– GDP targets
– Unemployment
– Housing Starts
– Crop Reports
– And the list goes on and on…
As Nassim Taleb said, “beware the errors of big data.” But we have all this data to use, and we gotta do something with it. As Freakonmics put it in a podcast a few years ago:
It’s impossible to predict the future, but humans can’t help themselves. From the economy to the presidency to the Super Bowl, educated and intelligent people promise insight and repeatedly fail by wide margins.
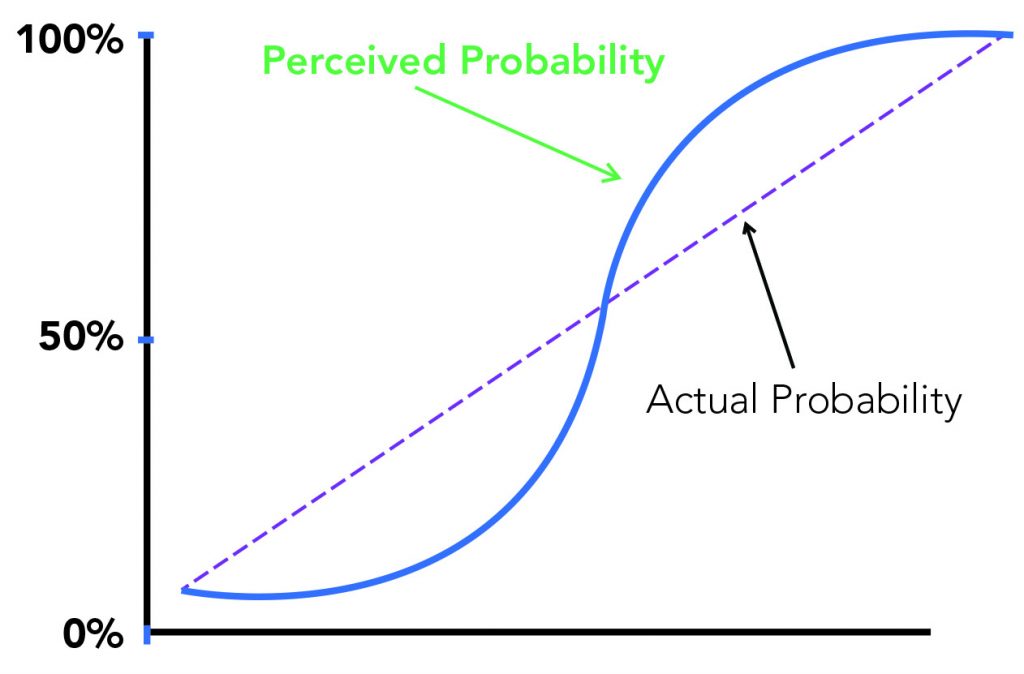
Having more information about a market, a stock price, global macro trends, or basketball doesn’t guarantee you know the future. That’s why, as they say, they play the game. And that bears remembering by all as we move further and further towards a world where Amazon orders you more toilet paper and delivers it to your house before you need it – and hedge funds sell JC Penny stock based on satellite images of their parking lots – and cars drive themselves. If our whole world starts to rely more and more on data driven probabilities, we humans need to understand them a lot better. Our un-scientific graph of how human’s perceive probabilities versus the actual probability of something happening are as follows:
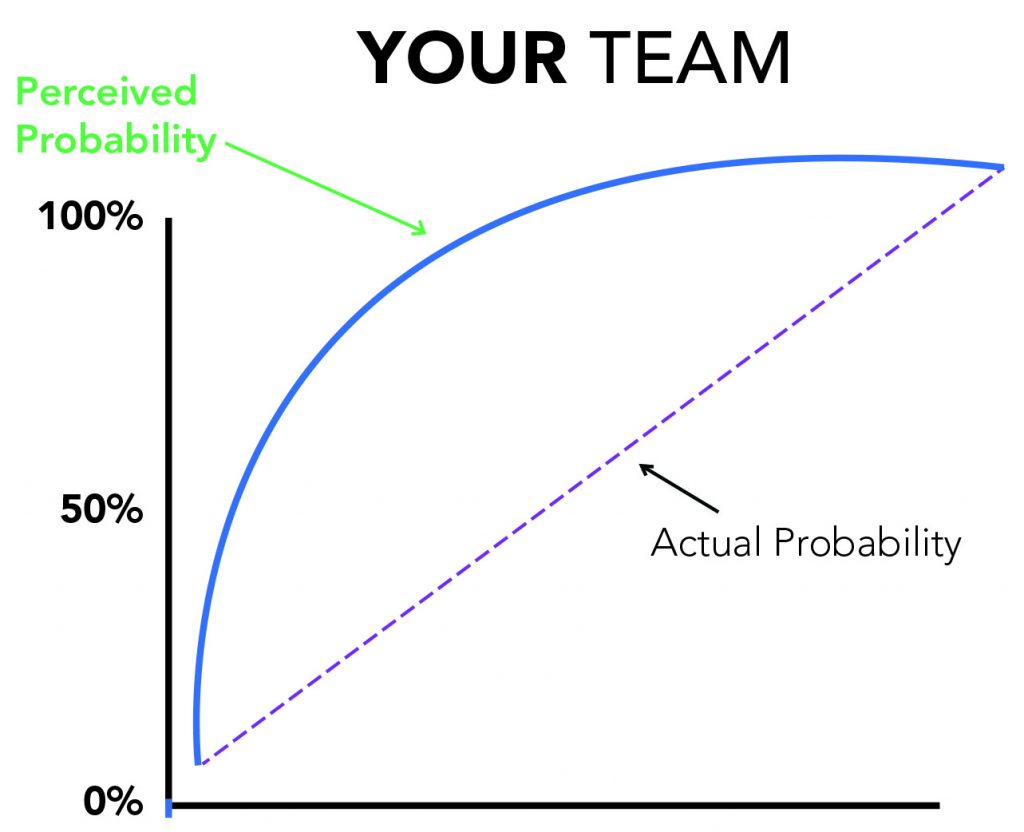
And of course, if its your own team or you have some preconceived cognitive bias working up there in between your ears, it might even look more like this:
Anyway, enough math and graphs on the eve of March Madness. These predictions and filling out brackets and all the rest are fun, after all, because unlike other “playoffs,” there are more chances for upsets and your underdog team seems to have more of a fighting chance. Enjoy the madness ! (just don’t let your march madness bleed into your investment philosophy).