
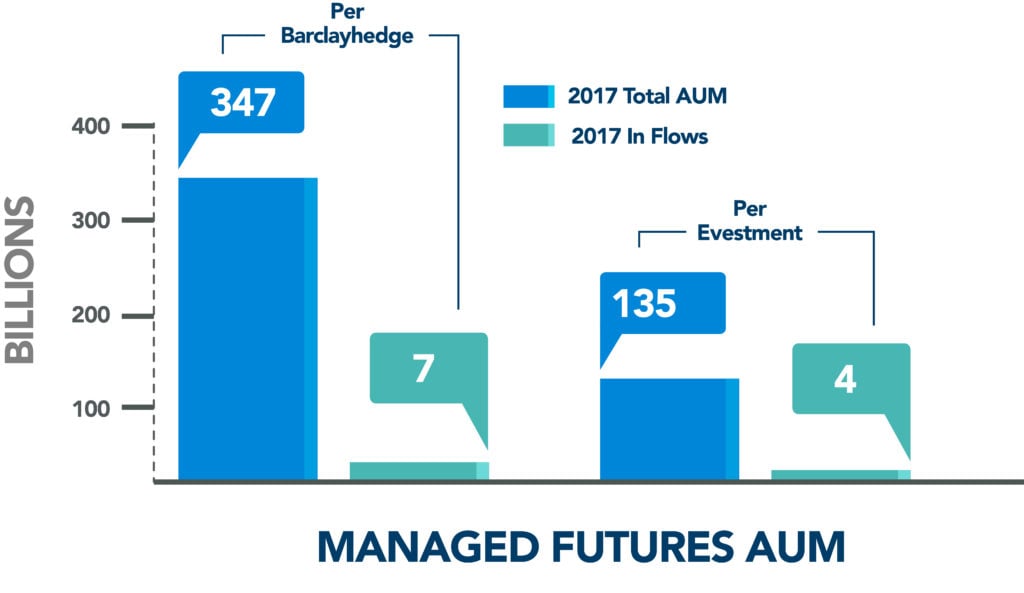
How much money under management is there in the CTA (Commodity Trading Advisors) space? Well, as we’ve covered before, this is a bit of a moving target depending on what source you go with. There’s long time managed futures database BarclayHedge reporting a new record high of $347 Billion, but Nasdaq owned eVestment showing just $135 Billion of assets for managed futures focused funds.
What’s the difference? Well, like most situations, a lot of it comes down to labels. Databases consider certain hedge funds to be a CTA and some CTAs consider themselves to be hedge funds. And what about crypto funds doing ICOs, of which some managers have been submitting returns to CTA databases, but surely don’t fit in the classic definition of managed futures. And then there’s the fund of funds and managed futures mutual funds, which when reporting their own assets can create a double counting situation – where the assets are part of the fund of fund and part of the individual managers AUM number. It can get confusing fast, so each year, we go through the exercise of looking through the Barclayhedge CTA database to highlight any big differences those who care about such things should be aware of.
AUM Totals
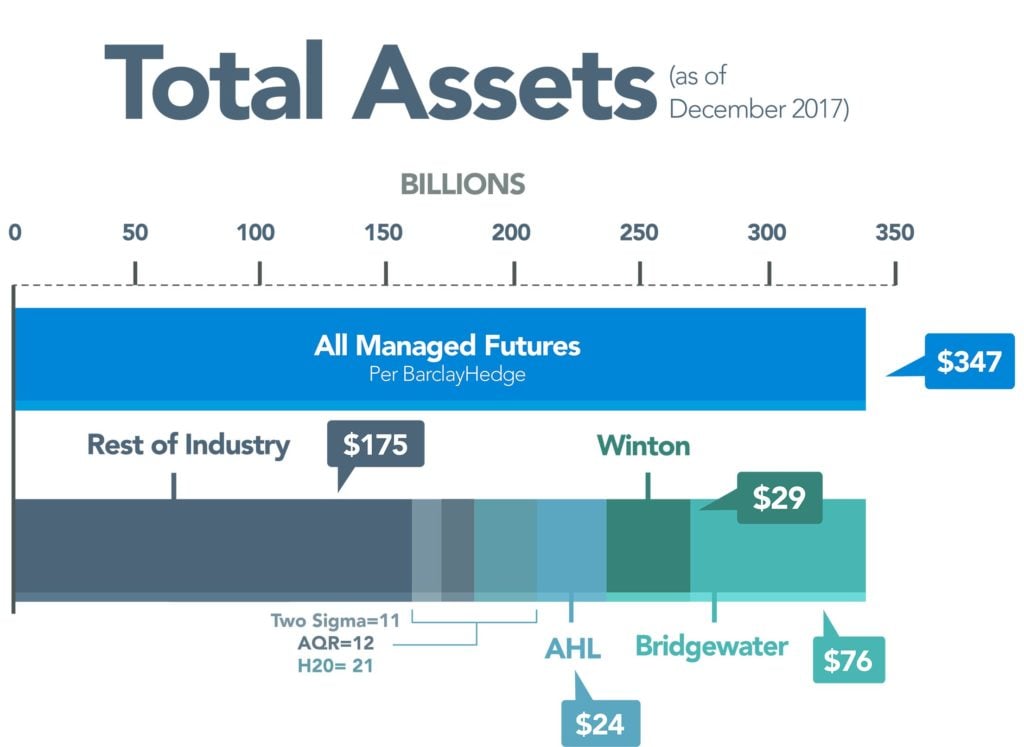
The biggest reason for the difference in AUM numbers comes down to BarclayHedge’s inclusion of one of the world’s largest hedge funds, Bridgewater, being included in their managed futures assets under management. Here’s the breakdown of Barclayhedge’s numbers as of the end of 2017 as close as we can figure them looking at the raw data, showing a good 50% of that $347 Billion coming from just six managers: the aforementioned Bridgewater, Winton, Man AHL, AQR, H2O, and Two Sigma – nearly all of which have substantial equity trading programs in addition to their futures based funds.
AUM Flows
Managed Futures gained $7.3 Billion in allocations from investors last year according to the BarclayHedge numbers – and $3.86 Billion according to eVestment’s numbers. Both of which are healthy inflows considering Managed Futures had a lack-luster year in performance. What we are interested in, is finding out where that money went inside of the Managed Futures industry. As we’ve discussed before, there’s a check the box mentality among large allocators which narrows their universe of possible investments to just a handful of very large managers, which leads to a disproportionate of money belonging to a few, select managers. But the tides appear to be turning (at least for this year), as almost all of the inflow went to what we call “the field” (i.e. excluding the top AUM holders in the database for different reasons). In fact, if you take out the outflows from Winton (which doesn’t even like to be called a CTA), AQR (what many consider to be the bell weather of Managed Futures performance), and Bridgewater (which isn’t a CTA); the field of Managed Futures actually took in $11.7 Billion in 2017!

This seems like reason to celebrate for emerging and mid-size funds yearning for the big leagues of Billions under management. But when we jump over to the eVestment numbers – we see a different picture, with Evestment reporting that sub $1 Billion under management funds actually shed -0.32 Billion in 2017 while the greater than $1 Billion funds added $4.1 Billion. That doesn’t seem to mesh with the outflows for behemoths AQR and Winton and tells us the sweet spot for asset raising was in the large but not too large category of funds between $1 Billion and $10 Billion.
Of course, all of this may amount to little given the poor performance across the space in February, which led to elevated levels of outflows per Evestment:
Managed futures managers faced the consequences of historic performance declines. Investor sentiment toward managed futures strategies had been defying the gravity of recent returns. In the twelve month span ending February 2018, an estimated $11 billion flowed into the universe, despite performance losses in the prior six month period. While there had been some pauses within this one year allocation window, it wasn’t until February 2018’s historic performance losses that investors reacted in a proportional way. The level of redemptions seen in March is on par with some months in 2013/2014, when the segment was facing elevated outflows after poor returns in 2012/2013.
It’s only May, but as of now, we may have seen the top in Managed Futures assets under management (whether using the BarclayHegde or Evestment numbers) until they are able to gain back those February losses and some. Elevated volatility should help, whether it comes from continued moves in energies and currencies or stock market losses via a good old-fashioned volatility spike.