
March madness is baaaaacccckkk. And so is FiveThiryEight and others like them running boatloads of statistical analysis to arrive at probabilities for each team advancing through each round.
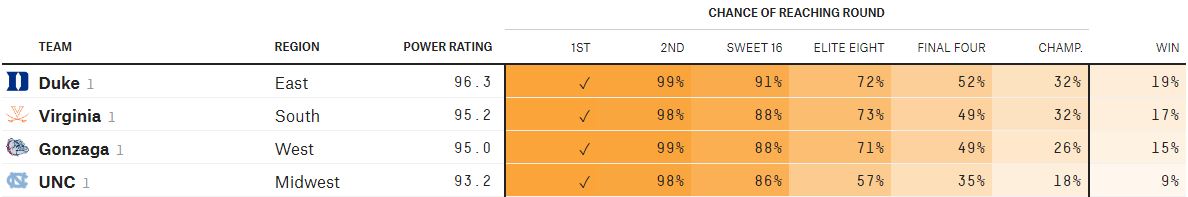

Duke with a 91% chance to reach the Sweet 16 and 52% chance to reach the Final Four. Sign me up, those are some pretty good odds…..said about 40% of entrants in ESPN’s bracket challenge. But they are waaaay off the true odds (as put forth by FivethirtyEight above (19%) and the Washington Post below (15%).

What’s going on here? Well. One, us humans are pretty terrible at understanding probability. And two, our computers are pretty terrible at correctly modelling something with about a zillion degrees of freedom like the March Madness tournament, which has 9 quintillion possible bracket combinations!
Why aren’t the computers better at modelling these probabilities? It’s because it’s all based on past performance, as in these statistics might be the best model we have to know what might happen in the future, but that doesn’t actually mean it’s going to happen. It’s not like predicting the percentage probability of rain in the very near future, based on the current air pressure and models, or predicting elections based on the number of registered Democrats, Republicans, and Independents and exit polls where you can glean a bit of inside information. There’s no statistic showing how each player will perform in each match. That’s why sports are exciting because you don’t know who is going to win.
Case in point, Zion blowing up his shoe in the opening minutes of a match up with UNC that cut Duke’s probability of winning that game by half or more.
What was the probability of a multi-billion global shoe brand’s product literally blowing up on the biggest stage for the biggest star? About the same as the stock market dropping -20% on Black Monday 1987. Even if it was in the model, it would show up as something like .000001%. Real life, with a round ball and 100 fingers on the court at a time trying to get a piece of it, doesn’t follow a normal distribution that lends itself to assigning probabilities with any real level of confidence. Or, put another way. That 19% chance for Duke to win it all, the highest by far of any team, still means 81 out of 100 times with the same setup as this – they won’t be cutting down the nets.
And that’s the issue we have as investors (in brackets or otherwise). We see Duke with a 19% probability to win it all, versus say, Michigan with a 5% chance, and end up with 10 times more people picking Duke to win it all than Michigan (despite the odds only being 4 times higher).
Effects like mental accounting, herd behavior, anchoring and high self-rating, all concepts in behavioral finance, play a significant role in how we view probabilities, skewing them towards or away from those biases. Now, you can model the heck out of march madness or an investment model and come up with some really confident probabilities that x or y will happen. But at the end of the day, they are just guesses. They’re very good, very calculated guesses using equations and calculations designed to remove biases, but they’re still guesses.
How we Perceive Probability
Still, it’s fun to pick a team. And more and more these days, we humans are relying on some sort of algorithm or quant model to help us pick complex things like the 9 quintillion possible combinations in the bracket. Surely, the self-driving car you’’ll be sitting in one day will have some code in there somewhere which assigns a 99.9999999% probability that the object its speeding towards at 75mph is just a plastic bag, not a small child crawling across the road, so no swerving needed.
That may work for the car, and if we hit one baby out of a few thousand plastic bag/baby confusions over a few decades, maybe we’re good with that as a society. (maybe?)
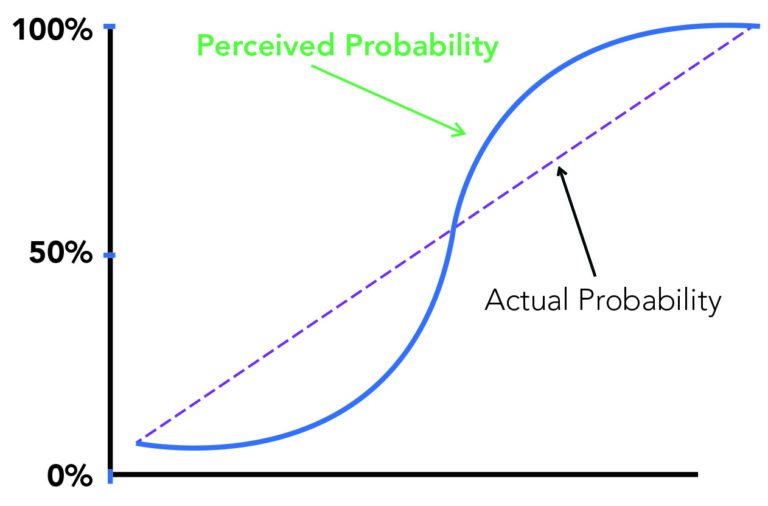
But can we really tell the difference between Duke’s 91% chance of reaching the Sweet 16 and UNC’s 86% probability. Those both just seem like it is going to happen, because humans have a really hard time understanding what those percentages actually mean. If our whole world starts to rely more and more on data-driven probabilities, we humans need to understand them a lot better. Our un-scientific graph of how humans perceive probabilities versus the actual probability of something happening are as follows:
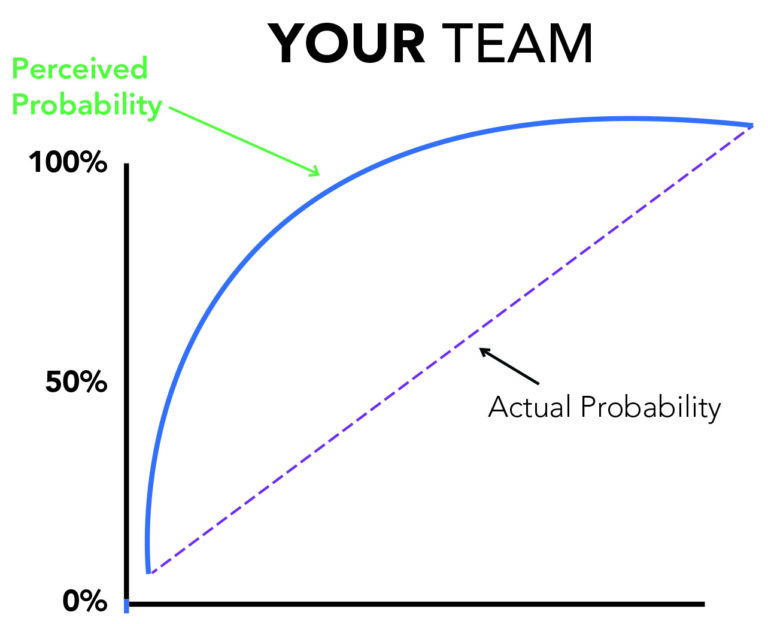
And of course, if it’s your own team or you have some preconceived cognitive bias working up there in between your ears, it might even look more like this:
Don’t get us wrong, cheering on a team can be fun, and putting some stats and modeling behind your picks might be the start to your budding quant career. But know that the statistics don’t really have a way of letting you know what’s going to happen. They are really telling you what would have probably happened given all we know at that point in time, IF we ran this simulation a few thousand times. That might work for a Netflix recommendation engine or self driving car algorithm – but when it only takes 1 “wrong “ simulation to blow up your bracket – those probabilities are going to leave you wanting a bit.
For now, go team!