A simple question, really. But not one we read much about in today’s world of instant gratification and investments jettisoned at the first signs of stress. So, when we were sent the latest research piece by Chris Cole of Artemis, we dug in (you can read the piece here). Now, Cole loves him some animal metaphors – as evidenced by their deer logo, and title of this piece – the allegory of the hawk and serpent, but it was the subtitle which caught our eye: How to Grow and Protect Wealth for 100 years.
Cole’s premise is quite simple, and comes back to the thing investment managers are always trying to get through to their clients…..judge investments not by their performance this month, this quarter, or even this year – but over a full investment style. Cole sees that bet, and re-raises it 4 or 5 times by saying forget the typical amorphous “investment cycle”. What does a portfolio look like over many, many, many different investment cycles spanning booming growth, nasty drawdowns, inflation, stagflation, and everything in between. What would it have to look like to not just end up erasing all of the boom time gains (the serpent) and in the inevitable busts (the Hawk).
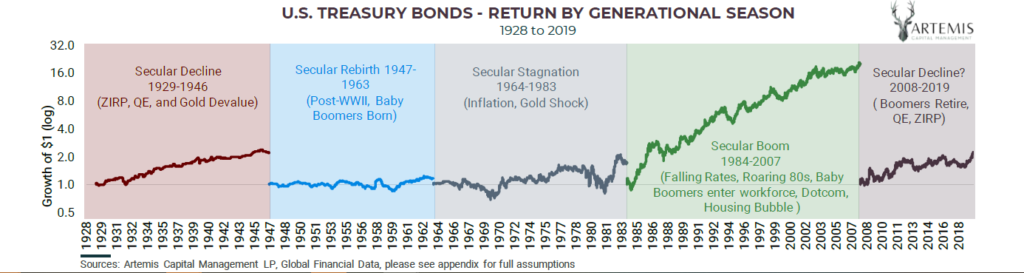
The successful 100-year portfolio must be able to navigate the secular booms of the Serpent (1947-1963, 1984-2007) while not losing capital on either wing of the revolutionary and regenerative eras of the Hawk (1929-1946, 1964-1983). The best portfolio balances assets that profit from either regime. Many investors assemble a varied portfolio of asset classes thinking there is safety in diversification, but in a crisis, the portfolio is exposed as a leveraged long-growth portfolio with no real diversification at all. Another class of investors believes they can always time the wild cycles of risk when, in fact, they can barely manage the demons of their geed and fear. The greatest threat to 100 years of prosperity is neglecting the lessons from long-term financial history and having no true diversification against secular change.
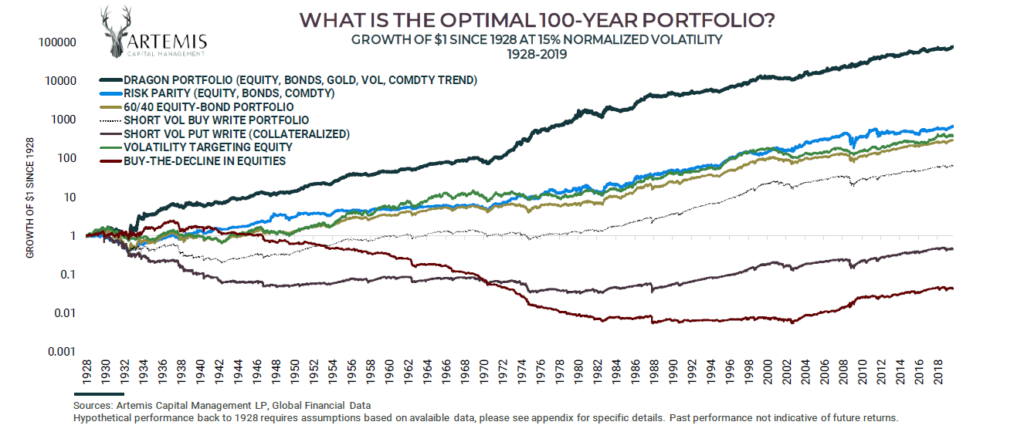
The answer for Artemis is what they call the Dragon portfolio. The Dragon, according to philosopher Pliney the Elder, being a serpent so tightly wound around a hawk that they appear as a single animal, a sort of ‘winged serpent. Artemis’ Dragon portfolio is designed to have components which profit from both times of secular growth with those of secular decline. Simple enough… but how exactly do you go about this, much less test it going back 100 years. Artemis did the work, recreating many modern financial portfolio methods like risk parity and the 60/40 portfolio and testing them through multiple generations and one lifetime (90yrs) back to 1928. Here’s what they found:
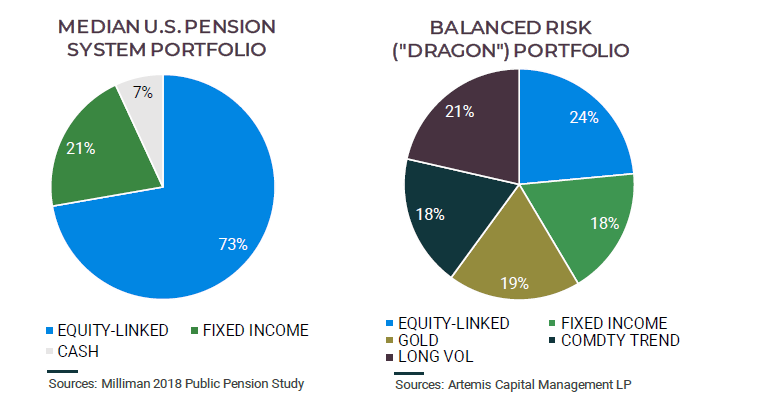
Assets like Long Volatility, Gold, Commodity Trend, and Discretionary Global Macro should be core portfolio holdings. The optimal portfolio, since 1929, included risk weighted combinations of Domestic Equity (24%), Fixed Income (18%), Active Long Volatility (21%), Trend Following Commodities (18%), and Physical Gold (19%). This allocation is highly unorthodox compared to a Traditional Pension Portfolio dominated by equity Linked Assets (73%) and Fixed Income (21%).
What’s really happening here is that the Dragon is not the Serpent and Hawk mating, it’s everybody’s typical short volatility portfolio (think – stairs up, elevator down movement of stocks) merged with a long volatility portfolio. Artemis is a long volatility manager, after all, and talking up their book, so to speak. But that doesn’t make them wrong. They are talking about what we’ve covered before – protecting against the Black Swan while capturing the White Moose. A sort of selling options and buying options at the same time. It’s having hurricane insurance that doesn’t just rebuild your house, but leaves it better than it was before the storm – at a compounding non linear rate. Now, we can all say – whatever… we already know that we need some tail risk protection. Cole would like say, do you really – Mr. Pension. But we’re hopeful the readers of this blog surely know this and research top managed futures, volatility, and global macro managers in our database to provide that long volatility exposure when the stock market (or real estate, or PE, or VC, or the economy as a whole) takes a break.
But Artemis is going the extra mile here. They aren’t just talking their book. They are showing that it’s about more than just active long vol (what they do, essentially providing a long options profile via various methods aimed at doing just that without the implicit cost of doing just that). It’s about Gold, and Trend, and more to really cover all the path dependencies that exist over 100 years. Their graphics breaking down performance across 5 different economic eras over the past 100 years are particularly interesting, and none of them show an asset that performs across all of the periods. And that’s the point. In a twist of the quip – on a long enough timeline, everyone dies…. Artemis shows that on a long enough timeline – every strategy sucks. The problem us humans have, is that if it has sucked more recently than something else sucked – that’s a particularly hard thing to not do get all panicky about. The question is whether you get scared by that… and jettison everything as soon as it sucks, or keep it in a portfolio despite it being down, flat, or not up as much as the S&P. The question is whether you are playing a 100 week game, or a 100 year game?
Since we wrote this post (and Chris wrote the original piece), volatility has exploded, both during the massive sell-off in March as well as in the shocking market melt-up since then. Simply put, the dragon has been unleashed. The twin risks of the left tail (deflationary deleveraging) and right tail (inflationary deleveraging) loom large. As Chris wrote in his 2020 report, “to thrive, we must embody the cosmic duality between the hawk and the serpent. Watch Chris talk through it all with CIO of Mutiny Fund, Jason Buck.