
If anyone doesn’t know yet based off this month, and VIXmageddon in 2018, and the 2008 financial crisis – the VIX, or fear index as it’s known to have been called from time to time, rises quite rapidly when the stock market falls. There are all sorts of reasons for this, but the primary one is that the index is made up of option prices on the stock index, and as markets fall, people pay more for the Put options the falling market is getting closer to (or through). The end result is a rather persistent negative correlation between the sock market and the VIX. And in particular the S&P 500.
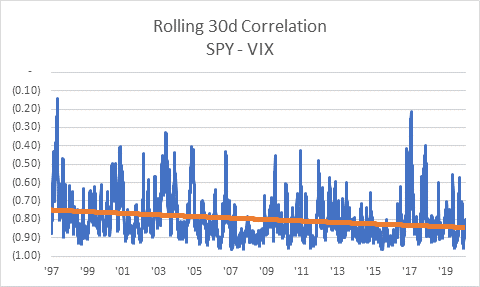
Here’s what that looks like via the rolling 30 day correlation between the SPY and VIX, with the logarithmic trend line down there around -.80.
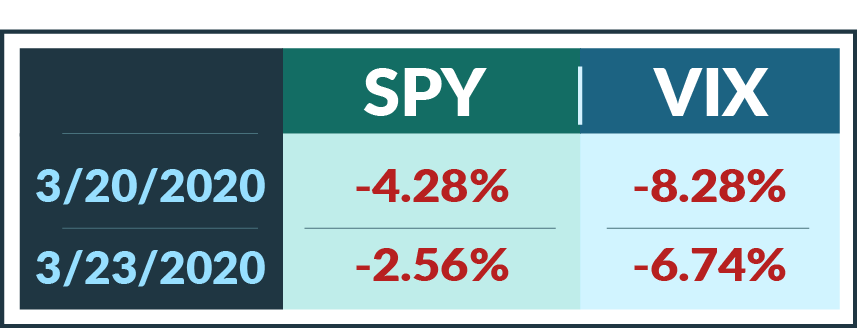
Cool…. All’s well in the world – and VIX goes up when stocks go down. Except….every now and then, what happened last Friday and this Monday happens:
Wait… what? How are they moving in the same direction when they are negatively correlated? Well, a few things.
1. Just because they have been negatively correlated doesn’t mean they will be negatively correlated on any one particular day… or back to back days. Especially, and this can be point two….
2. ….When the VIX is up close to all time highs. We spoke on a recent podcast with Deepfield Capital’s Bastian Bolesta about a theoretical upper bound for the VIX, and there is a little bit of that going on.
3. They are two different instruments, with a bit of a mismatch in what time frames thay are looking at. The S&P, and stock market in general, is a forward looking indicator looking as much as 12 months our on what the economy and company earnings are likely to look like. The VIX is measuring the expected annualized volatility over the next 30 days.
What the VIX Peeps Say:
Confusing, indeed. Which led us to reach out to our VIX peeps on Twitter and via email and ask what the xxx is going on. Here’s how these pros view this phenomenon:
Maybe it’s as simple as everyone is grossing down. Depending on when they were purchased, VIX hedges have likely become too large after this month
— Matt Thompson, CFA (@dynamicvol) March 23, 2020
$VIX started super high. $VIX 64 is implying a daily 4 % move every day for the next 30. correlations are starting to normalize. Tech beating value past 2 days.
VIX peaked in oct 08. We saw 6 months of market lower stocks lower.
— Joe Tigay (@JoeATiger) March 23, 2020
At these high sustained levels of volatility, the transmission mechanism between the underlying and derivatives market “breaks down”. There is just too much “noise” in the market for this relationship to function. The malfunctioning of these “markets makers” and lack of liquidity at these levels do not help . Furthermore, some of the high frequency traders taking roles of market makers at low volatility cease to provide liquidity at high volatility. – Anonymous
_________________________________________________________________________________________________VIX is a very misunderstood instrument. Many people erroneously believe that it simply goes up when the market goes down and vice versa. That is not the case. VIX moves with volatility. Market volatility can and does move in the same direction as markets from time to time. Market volatility can increase with rising markets and market volatility can decrease with falling markets. Therefore, what we have seen play out in the last three days is nothing more than a low-probability, but fundamentally possible, outcome. We view the decline in VIX has gotten ahead of the math. But in these environments, none of us should be surprised if short-term dislocations occur.
Furthermore, the options market likely sees the stablization of new COVID-19 cases in parts of Asia and the hope of stimulus as bullish. Therefore, rather than buy equities, market participants have elected to play the bullish scenario by selling volatility. Hence, the wind seemed a little at the backs of those trades, at least for now. This whole situation will take months and quarters if not years to play out. We have not seen the last of opportunities. – Timothy Jacobson, Pearl Capital Advisors
_________________________________________________________________________________________________
In most cases, the VIX spot price isn’t terribly useful as an indicator of equity strength or weakness. Much more useful is the VIX futures curve, which also depressed significantly even as $SPX was dropping today. This is actually not terribly different than what happened a week earlier, but in reverse. The VIX futures curve provides general insight into the risk perception of the broader market. Today, the market is positioning for a US fiscal stimulus package that is expected to strengthen the markets. Despite being voted down twice in the senate, it is apparent that even if it takes a couple extra days, there will in fact be a massive stimulus package. The shift lower in the VIX complex today is a reflection of that expectation. Nobody really wants to be caught holding long volatility at 70 when the market calms.
Keep in mind that implied volatility peaks long before the equity market bottoms. Also consider what VIX at 75 means. It is generally an indication that a 1 standard deviation move in $SPX would be nearly 5% on a daily basis. Even if the equity markets are expected to continue lower, it would be presumptuous to assume that daily moves will continue to be on the order of 5% over an extended period. At some point, the daily moves must calm somewhat, and even if they were to remain in the realm of 3% per day, the VIX must then drop below 50 to accurately reflect expected realized volatility. – Brett Nelson, CIO and Founder – Certeza Asset Mgmt.
How frequent is this?
The Joe Tigay tweet saying there was six months of VIX lower, market lower back ion 2008 piqued our interest, so we went to the tale of the tape to see just how frequent this reversing of the normal negative correlation is. Here’s what we found looking back day after day all the way back to January of 1997 (about 23 ¼ years)…and after filtering out days in which the S&P moved less than 1% in either direction.
-
- 88 out of 5,847 days (1.5%) in which SPY and VIX moved in the same direction (with SPY moving more than 1% up/down)
- 48 of those days (0.82%) were SPY moving UP more than 1% and VIX also moving UP on the day
- 40 of those days (0.68%) were SPY moving DOWN more than -1% and VIX also moving DOWN on the day (2 of those were last Fri and this Mon)
- The UP/UP days saw an average move across both of just 2.09%. and max of 8.67% (May 5th, 1997)
- The DOWN/DOWN days saw an average move across both of just -1.96%, and min of -6.39% (8/25/15)
- Last Friday and this Monday were the 2nd and 3rd biggest down/down dislocations in the past 23 years
Here’s the chart plotting the occurrences per month, blue SPY UP/VIX UP and orange (SPY DOWN/VIX DOWN), and a few things stand out. One, this is yet another argument supporting the finding that volatility clusters. Abnormalities in volatility also cluster – and do so around times when volatility is spiking. Two, there were lots of up/up days in the late 90s during the internet boom – showing that upside volatility is a real thing….we just haven’t really witnessed it in quite some time. And finally, it’s interesting to note that it has become a rarer and rarer occurrence since the financial crisis and Fed interventions, and all the rest. Is this the Fed put showing itself in the stats? Or just a result of the extra low vol regime we’ve been in?

Happy VIX’ng from home!