How’s Managed Futures Doing during the Corona-Crash

We’re going to get into a bit of a deep dive on just how the more classic managed futures profile (you, know, crisis period performing trend follower types) have performed during the past month and a half. We’ve covered some of the non-classic vol traders doing well here and here, but how has the asset class as a whole done? Part one of our look will analyze how Managed Futures are rather well known for their crisis period performance.

Here’s a graphic form our Why Managed Futures page to prove that point:

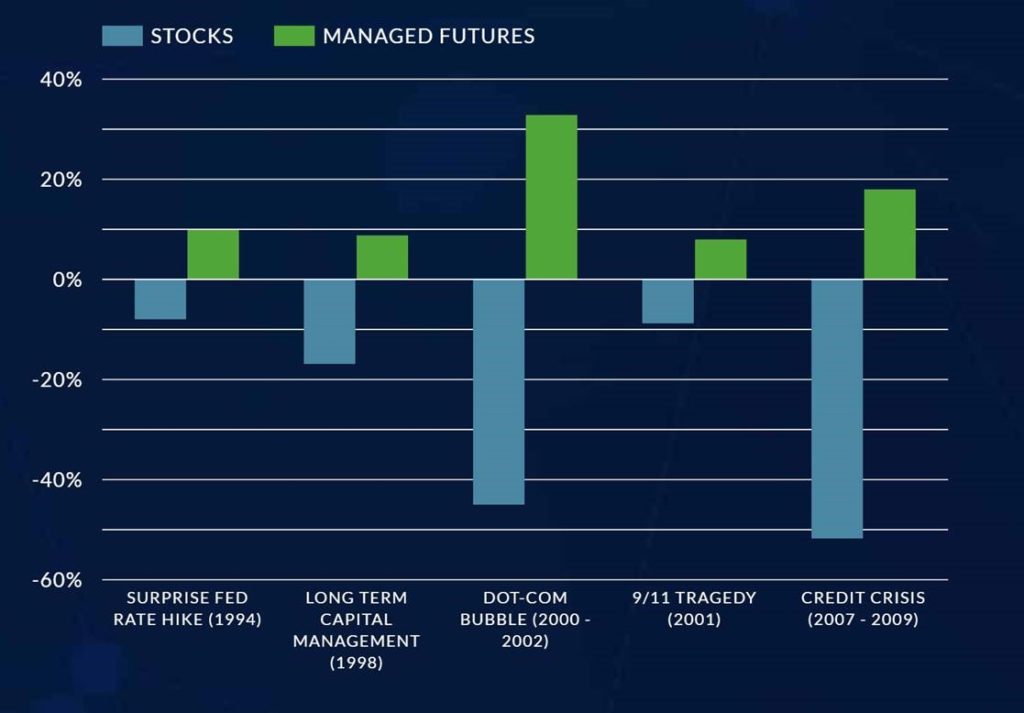
But they’ve been relatively quiet so far in this virus-fueled market crash. Managed Futures per the SocGen CTA Index have put up a -1.49% in February and +0.14% in March. That’s 14 basis points…And stand at -0.32% as of April 6th. As we said…not too exciting, especially given the severity of the stock market sell-off. When US stocks are down more than -33% at their lows and Oil having shed -60% in 2020, most people are probably looking for a bit more out of their managed futures allocation.

So what’s going on?

Man… that was Fast
It’s hard to believe, but US stocks were at all time highs just a short 24 market days ago, on February 19th.  The market went from all time highs to losing one third of its value in 23 trading days! Just 23. For trend following models that often use lookback periods going 30, 60, or even 90+ days – a 23 day move is usually viewed as nothing more than noise. For comparison, the Dot.com bubble took 389 days for US stocks to go from all time highs to down more than -34.8% (it went down more than that, but we’re normalizing to -33% for comparisons with the 2020 Covid-19 move). And the Financial Crisis market sell off took 260 market days to go from all time highs to down -34.7%.

But that’s all talking just about the traditional, short volatility, stock side of the ledger. What about the long volatility, crisis loving managed futures side? Well, as you can see in the charts below, managed futures are sort of like the big diesel engine that takes a while to hit its stride. We’re talking 160ish days into the Dot.com bubble (admittedly before it picked up steam), and 50ish days (although it did start rising nearly from the get go) into the Financial Crisis. The real negative correlation doesn’t kick in until the later stages of the crisis.

Why – because the first parts of the move are managed futures setting the table. That’s when they exit any long positions and start entering short positions. The diesel engine starts kicking in when and if those short positions start to pick up steam (can you pick up steam in a diesel engine?), resulting in the near opposite looking charts at the end of both the dot.com bubble and fin crisis charts.

Series1 = SPY and Series2 = SocGen CTA Index

We don’t yet know if that was the extent of the market sell off related to Corona Virus, or whether there are more legs to come. As a point of reference, the dot.com bubble saw it take another year and a half after falling its first -33% to put in a low (a low that was -11% lower) and the financial crisis saw the eventual low put in 5 months after the first -33% down (falling another -21% lower). But we do know classic profile Managed Futures programs will be there (now positioned on the short side) when and if those further legs down appear. That’s no more than a little solace to those who expected more out of managed futures in this sharp first leg down, but it is fitting with the overall profile…. mostly. (We’ll get into why and how it may be a little worse than it should have been for the bigger CTAs in our next installment)

Disclaimer
The performance data displayed herein is compiled from various sources, including BarclayHedge, and reports directly from the advisors. These performance figures should not be relied on independent of the individual advisor's disclosure document, which has important information regarding the method of calculation used, whether or not the performance includes proprietary results, and other important footnotes on the advisor's track record.

The programs listed here are a sub-set of the full list of programs able to be accessed by subscribing to the database and reflect programs we currently work with and/or are more familiar with.

Benchmark index performance is for the constituents of that index only, and does not represent the entire universe of possible investments within that asset class. And further, that there can be limitations and biases to indices such as survivorship, self reporting, and instant history. Individuals cannot invest in the index itself, and actual rates of return may be significantly different and more volatile than those of the index.

Managed futures accounts can subject to substantial charges for management and advisory fees. The numbers within this website include all such fees, but it may be necessary for those accounts that are subject to these charges to make substantial trading profits in the future to avoid depletion or exhaustion of their assets.

Investors interested in investing with a managed futures program (excepting those programs which are offered exclusively to qualified eligible persons as that term is defined by CFTC regulation 4.7) will be required to receive and sign off on a disclosure document in compliance with certain CFT rules The disclosure documents contains a complete description of the principal risk factors and each fee to be charged to your account by the CTA, as well as the composite performance of accounts under the CTA's management over at least the most recent five years. Investor interested in investing in any of the programs on this website are urged to carefully read these disclosure documents, including, but not limited to the performance information, before investing in any such programs.

Those investors who are qualified eligible persons as that term is defined by CFTC regulation 4.7 and interested in investing in a program exempt from having to provide a disclosure document and considered by the regulations to be sophisticated enough to understand the risks and be able to interpret the accuracy and completeness of any performance information on their own.

RCM receives a portion of the commodity brokerage commissions you pay in connection with your futures trading and/or a portion of the interest income (if any) earned on an account's assets. The listed manager may also pay RCM a portion of the fees they receive from accounts introduced to them by RCM.

Limitations on RCM Quintile + Star Rankings

The Quintile Rankings and RCM Star Rankings shown here are provided for informational purposes only. RCM does not guarantee the accuracy, timeliness or completeness of this information. The ranking methodology is proprietary and the results have not been audited or verified by an independent third party. Some CTAs may employ trading programs or strategies that are riskier than others. CTAs may manage customer accounts differently than their model results shown or make different trades in actual customer accounts versus their own accounts. Different CTAs are subject to different market conditions and risks that can significantly impact actual results. RCM and its affiliates receive compensation from some of the rated CTAs. Investors should perform their own due diligence before investing with any CTA. This ranking information should not be the sole basis for any investment decision.

See the full terms of use and risk disclaimer here.

logo