
We got off a call with an investor the other day who mentioned that the past two+ years have been a great microcosm of different full cycle market environments – with:
- 2018 = SPY -4.56% = a down stock market in 2018, including the volatility explosion in Feb of 2018 and odd sell off with no corresponding volatility spike in Dec of 2018
- 2019 = SPY +31.22% = a screaming higher rally in stocks in 2019 and resulting crush of volatility
- 2020 = SPY -4.87% (as of end of May) = a generational, historically sharp sell off and volatility spike, with nearly as quick snap back to even on the year
If ever there was a time to analyze how your investment choices are doing in terms of risk profile, ability to earn a return, and diversification properties – this 30mo period sure has been a good look.
Which brings us to the nearly $3 Trillion in global hedge fund assets. Yes, that’s Trillion with a “T”. How have hedge funds performed during this down/up/down/up period? We’ve been the first to say to the many media articles trumpeting how hedge funds have under-performed the S&P 500 that they don’t care – they are bananas, and you’re talking oranges.
And in other news…oranges don’t taste like bananas RT @finalternatives: Hedge Funds Trail S&P 500 YTD https://t.co/Ch4d5a3RQH
— RCM Alternatives (@rcmAlts) May 13, 2014
BUT… forget the generalities. What do the stats actually look like. We pulled the monthlies for Credit Suisse’s various hedge fund indices to dig into the math a little. Let’s start with just returns, as the press likes to do:
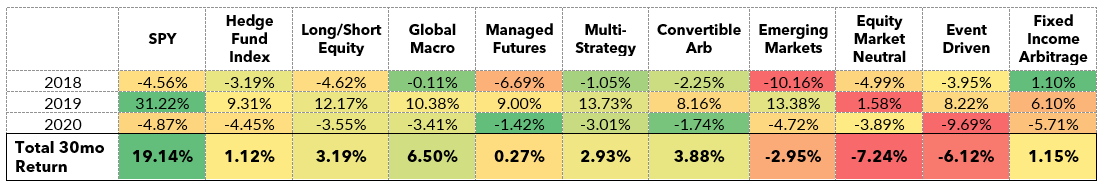
We agree – hedge funds appear to really suck by this measure, not just trailing by basis points, but an order of magnitude worse. Or even the completely opposite sign (looking at you equity market neutral and event driven). A closer look shows 2019 to be the main culprit, with the main hedge fund index outperforming by losing slightly less in the down periods of 2018 and 2020, but under-performing A LOT worse when stocks were up. For just 1/3 of the upside, we would expect them to have much less of the risk as well. So what do the risk metrics look like the past 30 months:

Alright, now this is getting to the more nuanced part of the calculus. Stocks are the MOST risky asset across these indices, with about double the worst drawdown and triple the volatility of the main hedge fund index (2nd column). While hedge funds were once considered wild, exciting, volatile ways to make more money – this shows they have become (on average) less risky, less volatile investment choices. As we said in a 2018 post: https://www.rcmalternatives.com/2018/08/why-theres-trillions-in-hedge-funds-with-stocks-at-all-time-highs/
..that’s why there’s $3 trillion dollars invested in hedge funds. It’s not about the headline number or absolute performance compared to stock indices. Hedge funds are given mandates and expected to exist within tight drawdown and volatility bands by investors. They are employed for specific purposes and mandates which involve much more than just return – and generally speaking – are way more concerned with controlling risk. Scratch that. It’s not just controlling risk, It’s about delivering an expected risk. That’s something a passive investment in the stock market can’t do. We can’t ask the S&P to just give us a 10 vol next year. But alternatives can and do. [which] allows the investor to set the risk to whatever they are comfortable with…
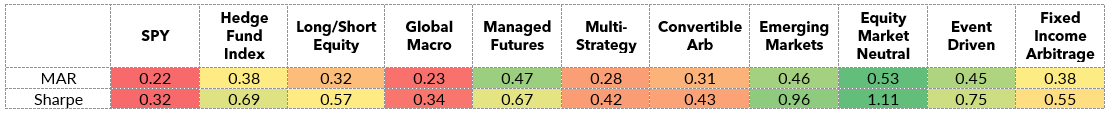
But, but, but… that risk control came at a steep price of just 1/3 of the upside, or 700 basis points in compound return when compared to the main hedge fund index. You may be willing to take on a little more risk for that extra 7% in return. Which is the whole concept behind risk weighting and analyzing risk adjusted ratios to see who is better on a risk adjusted basis. We can do a simple exercise and say that at an equal risk weighting (multiplying the hedge fund index by the annualized vol difference of 2.78), the hedge fund index would have an annual return of 1.28%. Problem is, that’s still well short of the 7.5% number from the SPY, leading us to believe the risk adjusted returns likely won’t make a great argument that hedge funds don’t suck. Here’s the return over drawdown (MAR) and return over volatility (sharpe) ratios for each over the past 30 months:

Ok, the SPY is absolutely crushing the main hedge fund index even on the risk adjusted basis, putting some major bullet holes in the boat holding the “yes, hedge fund under-perform on an absolute basis, but they outperform on a risk adjusted basis” theory. But at least we have some hedge fund strategies showing up to the party here, with Global Macro, convertible Arb, and multi-strategy at least in the conversation for similar risk adjusted performance. It’s likely no coincidence that those are three of the more non-correlated hedge fund starts to equities.
So now what? Do hedge funds suck? Will the $3 Trillion soon be $2.5 Trillion on its way to $500 Billion someday as investors flock into the better risk adjusted returns of pure stocks. In short…. No way. There’s no putting this genie back in the bottle, and there’s no shortage of investors who don’t believe the S&P 500 or any other stock index will NOT be the best risk adjusted performer over the next three years, or even ten, or twenty, or forty (see Japan 1980 to 2020 for more on that possibility). And in fact we see that argument in the past thirty months of data. We see that argument if we remove the 2019 performance from the analysis, and just look at the volatile down and up periods. Here’s the risk adjusted returns when we remove the banner year for stocks:
Without their huge year (which, admittedly, is a little like saying… besides that, Mrs. Lincoln – how was the play?). But without that huge year – the hedge fund indices are nearly all better risk adjusted performers. And that’s what investors are looking at. That’s what investors are buying. They have stock exposure. The desire to invest in hedge funds is typically not a binary choice – stocks or hedge funds. It is typically a combination – stocks and hedge funds, for this very purpose, to provide a different, better risk adjusted return during volatile times when
TLDR = yes, hedge funds suck….. in comparison when equity markets see a 30%+