
Special purpose acquisition companies, volatility arbitrage, black box AI. There’s no shortage of complexity in the alternative investment space. Which is perhaps why “All Weather” Risk Parity strategies have grabbed the attention of the institutional investor ilk; and started to leak into the mainstream investor mindset. Even robo-advisor Wealthfront offered a (rather misguided [1]) risk parity fund to the retail investor masses. And, of course, there’s the largest hedge fund on the planet – Bridgewater – and their omnipresent founder Ray Dalio – extolling the virtues of risk parity as their main DNA and offering.
It sounds simple, yet advanced. Risk, we all understand, as..well, risk. The amount of money you could lose. And Parity – that was a stroke of marketing brilliance – slightly editing balanced or equal into the more sophisticated sounding ‘parity’. We’ll never know if Bridgewater called it Equal Risk Asset Allocation or Balanced Cross Asset Beta whether those hundreds of billions would have come into the space. But we do know now that people like the concept of an All Weather risk parity portfolio.
What is it, exactly? Well, it’s an asset allocation strategy that balances risk between the assets in the portfolio. Take the basic 60/40 portfolio, where on the face of things you have 60% of your risk in stocks and 40% of your risk in bonds. Personal empires and more than a few McMansions have been built on that simplistic view. But, it’s not quite true when you look at the volatility of the two assets. When considering their risk as measured by volatility, you get this view (per ReSolve). That’s 94% of the risk in stocks on a monthly basis since 1900, which isn’t very balanced at all. A risk parity portfolio of stocks and bonds would seek to fix that, by reducing the allocation to stocks in favor of bonds until they both contribute the same risk.

Sounds simple enough. But… the devil, as always, is in the details – as a recent paper by Resolve Asset Management points out with great precision. Download the full paper here. Resolve asks, quite smartly, just what is meant by risk, diversification, and the other components of risk parity:
…there is little consensus among practitioners about how to define – and perhaps more importantly measure – fundamental inputs like diversity; balance; economic environments; and systematic risk factors. Should we measure diversity in terms of how well our investment universe spans exposure to demand shocks? Supply shocks? Inflation? Liquidity? Or are the true sources of risk un-observable and endogenous to markets themselves? Are we concerned about deviations in growth and/or inflation rates between countries or regions? Or are the true sources of risk un-observable and endogenous to markets themselves? How can we measure balance until we define the risks that we are trying to create balanced exposures to?
[further]…those risks may not occur with equal frequency. How should we think about diversity and balance if one regime is expected to manifest just 5 percent of the time with an extremely large impact, while another regime is expected to occur half the time, but with more moderate impact?
…Each framework for thinking about risk and diversity prompts a unique method for constructing portfolios, so risk parity can take on many different personalities to suit unique objectives.
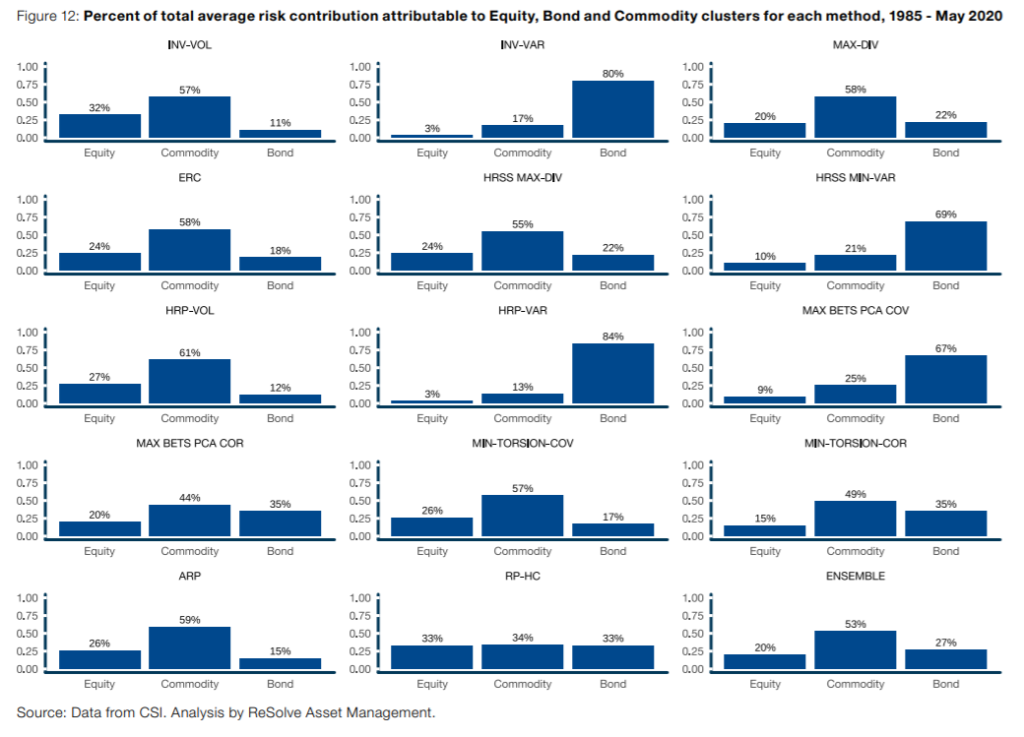
Whoa, it sure is more complex than the simple sounding ‘risk parity’ name would imply. Just how complex? Well, Resolve outlines no fewer than 15 different risk parity methodologies based on everything from sequentially weighted inverse cluster standard deviations to basic equal weight to minimum torsion factors derived from the covariance of an agnostic risk parity matrix.

Two of the money charts for us centered around the analysis of just how well each of these risk parity flavors did in actually spreading risk equally between components (with some rather surprising results showing some cases with up to 60% of risk still in one of bonds or commodities) and how they did in fulfilling their mandate of providing risk adjusted returns in different economic environments (a task made tougher by the lack of certain environments in recent history).

The TLDR summary is – risk parity, while simple sounding, is anything but. Whatever flavor you may be invested in or looking at investing in has made trade-offs between risk and diversification in the name of equalizing risk and diversification, and those trade-offs are going to have different return and risk profiles in future economic environments that may not be as you expect. So, as with most everything systematic and technical – an ensemble approach sure makes a lot of sense.
Head over to Resolve and download the full paper here.