
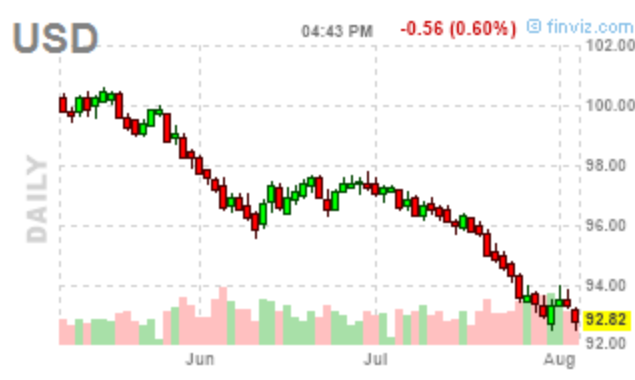
What do you get (besides a gold and silver rally) when you do $3 Trillion in stimulus, and the Euro countries find out they can do a coordinated monetary policy? A U.S. Dollar sell off! After spiking from around 98 up to 104 in the depths of the crisis, the U.S. Dollar has sold off rather heavily, falling down to 92 (as of our writing this, we have a knack for inadvertently calling a bottom as soon as we write up something about a market).
What’s happening? Well, if you’re scared that Trillions in stimulus makes runaway inflation a possibility, lessening the purchasing power of your fiat currency, you sell dollars and buy gold (or Silver, or Bitcoin). If you think the Eurozone has figured out how to all coexist and are stronger together than they are apart, you sell dollars to buy Euros, and so forth. The common denominator, is selling dollars.
What is the Dollar Index?
Ice Futures has a nice explanation of their US Dollar Index Futures here:
The U.S. Dollar Index (USDX) is a geometrically-averaged calculation of six currencies
weighted against the U.S. dollar. The U.S. Dollar Index was created by the U.S. Federal
Reserve in 1973. Following the ending of the 1944 Bretton Woods agreement, which had
established a system of fixed exchange rates, the U.S. Federal Reserve Bank began the
calculation of the U.S. Dollar Index to provide an external bilateral trade-weighted average of the U.S. dollar as it freely floated against global currencies.Which currencies are included in the U.S. Dollar Index?
The U.S. Dollar Index contains six component currencies: the euro, Japanese yen, British
pound, Canadian dollar, Swedish krona and Swiss franc. Before the creation of the euro, the original USDX contained ten currencies—the ones that are currently included (but not the euro), plus the West German mark, the French franc, the Italian lira, the Dutch guilder, and the Belgium franc. The euro replaced the last five of these currencies.Before the creation of the euro, which now accounts for 57.6% of the USDX, the weightings of the five historical European currencies were: German mark (DEM), 20.8%; French franc (FRF), 13.1%; Italian lira (ITL), 9.0%; Dutch guilder (NLG), 8.3%; and Belgium franc (BEF), 6.4%.
Specifically, the index finds the weighted geometric mean against the six different currencies. However, not each currency holds the same weight. As ICE points out above, the Euro holds a 57.6% weight, while the other weightings are JPY = 13.6%, GBP = 11.9%, CAD = 9.1%, SEK 4.2%, CHF 3.6%. So, with the Dollar Index having the exchange rate with the Euro Currency for more than half of its composition, it’s only natural we see U.S. Dollar Index Futures falling while Euro Currency Futures are rising. Indeed, our quick back of the napkin math tells us it would be quite hard, mathematically – for the Dollar Index and Euro Currency to move in the same direction.
Why are Managed Futures Excited?
Traditionally, a rally in the Dollar Index has proven to be very beneficial for Managed Futures. That’s because it typically means the other currency markets are also moving with the same sort of depth. The other part of the reason managed futures tends to do well when the U.S. Dollar is trending, is because the U.S. Dollar index impacts almost all commodity futures markets simply because those markets are priced in the U.S. dollar. That means, for example, a falling U.S. Dollar can translate to rising prices in dollar denominated futures markets (all else being equal).
Here’s a look at the historical performance of Managed Futures (as measured by the SocGen CTA Index) has performed in different Dollar Index periods of strong trendiness, which we measured by the 14 day ADX indicator seeing values greater than 40, and then looking at the percentage of days the indicator saw such high readings each year. Here’s what we found. Managed Futures love it some strongly trending USD, with all but one year in which more than 35% of days were in strong trend seeing gains (90% of time), versus just 60% of the time when there weren’t as big of a percentage of strongly trending USD days. What’s more – the upsides were completely different, with the trending USD periods seeing a much higher ceiling for their performance (40% of the time with double digit years) versus 0% of the years seeing double digit gains when strong trends in the USD weren’t as frequent. All in all, in the strong US Dollar trending years, we saw a max of +15.25%, min of -2.87% and average year of 8.22%, versus a max of 6.26%, min of -5.83%, and average of just 0.42% in the other years.
So bring on that U.S. Dollar weakness. CTA’s will welcome it with open arms.