

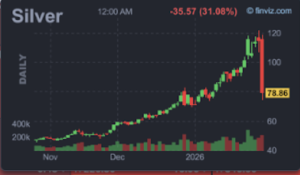
If you woke up Friday morning long precious metals, you experienced something that will stay with you for the rest of your trading career. Gold and silver suffered the biggest sell-off in years, in a whipsawing reversal of a scorching rally that’s lifted prices to all-time highs. Gold dropped as much as 10% to crash through $5,000 an ounce, while silver slumped -30% below $80 as the sell-off swept through the broader metals markets.
To put this in perspective for equity investors, silver’s -30% single-day plunge rivals Black Monday 1987, the worst day in S&P 500 history. The worst single day during the COVID crash was 12%. Silver more than doubled that on Friday.
Think of it this way – today’s range of $766 is about the range Gold had for 18 years from 1991 to 2009!
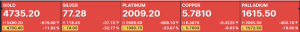
At approximately 12:30pm Friday in Chicago, Gold was off by more than -11%, Silver -33%, Platinum -24%, Copper -7%, and Palladium -20%!
These aren’t normal moves. Over roughly the past 25+ years (through 2025), gold’s price has changed by about 0.8% per day on average (in absolute percentage terms). Silver, being more volatile, has averaged around 1.4–1.5% per day. If you’re scoring at home, that’s about a 13 Sigma move for Gold and 22 Sigma move for Silver! You’re witnessing something that shouldn’t happen more than once in several lifetimes…statistically speaking. Yet here we are.
The Cure for High Prices Is High Prices
There’s an old commodity trading adage that everyone learns eventually, usually the hard way. The old line is that the cure for high prices is high prices. When prices rise, businesses tend to respond by producing more. If the price of something gets too high, then people buy less, which then leads to too much supply, which lowers prices. Rinse and repeat.
This dynamic is particularly acute for silver because it’s much more than just a precious metal industrial demand represents about 59% of consumption, much of which goes to the solar and electric-vehicle industries which benefit from its conductive properties. When prices rise to uneconomical levels, silver can be replaced with other metals such as copper or aluminum. A solar panel manufacturer who was happy to use silver at $25 an ounce starts making very different calculations when it’s trading above $100.
The conditions leading into Friday’s carnage were textbook. The surge in the prices of precious metals in late 2025 has continued into the early days of 2026, with gold surpassing $5,500 an ounce, silver breaking $119 per ounce, and platinum setting new all-time highs above $2,600. In terms of price returns since the end of 2024, metals have far outshined any other asset class: gold rose from $2,624 to $5,520 (up 110%), silver soared from $29 to $119 (up 314%), platinum climbed from $910 to $2,600 (up 186%), and palladium jumped from $910 to $2,084 (up 129%) as of January 29.
Read those numbers again. Silver up over 300% in roughly a year. Platinum nearly tripled. These aren’t normal returns, they’re parabolic. And parabolic moves have a nasty habit of ending parabolically; which wasn’t missed by several market pundits:
“We’ve been predicting a melt up in the price of gold since early last year,” said Ed Yardeni, president of Yardeni Research. But he added: “It has turned into a melt up in the prices of all precious metals, many base metals, and rare earth minerals.”
Guy Wolf, global head of market analytics at Marex, described the precious metals complex as “broken given unheard of volatility.” Markets such as silver and platinum are a fraction of the size of gold or major equity benchmarks like the S&P 500…the result is exaggerated price moves where relatively modest inflows can push prices sharply higher, making the rally feel detached from traditional supply-and-demand dynamics.
Why Friday?
After nine consecutive winning months, the simplest explanation is often the right one: profit-taking at month-end; retreating from all-time highs as investors locked in profits following the record rally. When you’re sitting on those kinds of gains and the calendar turns, even the most committed bulls take chips off the table.
The dollar’s rebound added fuel to the selling. The selloff came as the dollar rebounded after a report the Trump administration is preparing to nominate Kevin Warsh for Federal Reserve chair. The greenback’s rally undercut sentiment among investors who had been piling into metals after the president signaled a willingness to let the currency weaken.
What turned orderly profit-taking into a rout may have been some leverage unwinding. CME Group announced on January 30 that margins for gold, silver, platinum, and palladium contracts would be raised after Wednesday’s close, the second such measure within a week. When exchanges raise margin requirements, traders who were previously comfortable suddenly find themselves undercapitalized. Forced sellers hit the market, prices drop, more margin calls trigger, more forced selling occurs. For markets more broadly, the move highlights how quickly risk can reprice when an exchange raises margin requirements or when volatility triggers de-leveraging across commodity funds, hedge funds, and retail accounts using futures or leveraged products.
You’ve Seen This Movie Before
If Friday felt like déjà vu, that’s because this story has played out before, multiple times, with remarkably similar scripts.
The only time the gold-silver ratio dropped much below 20:1 was in early 1980, when it hit 17.4:1 in January. Readers of a certain vintage will remember the Hunt brothers’ attempt to corner the silver market in that year. Spot prices went from $6.20/ounce in January 1979 to $38.88 in January 1980 to $14.79 in January 1981.
This backdrop resembles prior silver booms, especially the 1979–1980 bubble driven by the Hunt brothers, when prices spiked more than 700 percent before collapsing after the exchange raised margin requirements and changed trading rules, triggering forced liquidations and a 50-plus percent one-day crash on Silver Thursday.
The pattern sure seems to repeat: parabolic rise, leverage build-up, margin hike, cascade liquidation, crash. The only question is timing.
The Silver Lining (Pun Intended)
Before you assume everyone who owned metals is now destitute, some context is in order. Despite the brutal selloff, as of writing this, gold remains up around 10-12% year-to-date while silver holds 20% gains.
So yes, Friday was brutal. But if you bought silver a year ago and held through today’s carnage, you’re still up 200%. The problem, of course, is how many people (outside of trend followers) actually did buy a year ago and held with discipline. Were most retail traders piling in during the parabolic phase, using leverage, and are now nursing catastrophic losses? This is exactly why we leave the trading to the professionals.
What the Professionals Do Differently
Professional trend followers almost certainly got hit today. If you’ve been running a systematic trend strategy, you were probably long precious metals, they’ve been trending up for months. There’s no way to avoid taking a loss when a market moves 8-20% against you in a single session.
But here’s the critical difference: trend followers limit their risk in any one market or sector by design. Position sizing is based on equal risk allocation between markets. An equal-risk approach means that the higher the volatility of an asset, the smaller a position it has in the portfolio. This is an essential step in constructing a well-diversified portfolio because of the wide range of volatilities exhibited by various assets.
This isn’t just theoretical portfolio construction, it’s survival architecture. A systematic trend following portfolio might have 30-60 positions across commodities, currencies, bonds, and equity indices. When silver blows up, the long bond position or short equity position might be doing just fine, dampening the overall portfolio impact.
In addition, during periods of high market turbulence, systematic managers may reduce position sizes or increase cash holdings. Conversely, in calmer markets, they might increase leverage to maintain their target risk level. The general goal is to keep risk and the expected distribution of returns steady over time, which can help smooth out returns and manage drawdowns.
Indeed, a look at the Trend Following positions for Silver inside of the Cockroach Fund, which allocates to different trend followers across multiple time frames, shows the position size peaking back in early December, and down to nominal exposure coming into today.
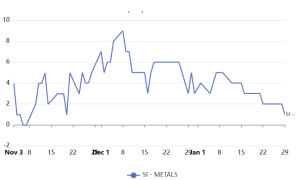
source: Mutiny Funds
Compare this to the retail trader who went “all-in” on silver futures at each new high during December and into January here. That’s not a trading strategy, that’s a lottery ticket with worse odds.
Trend followers surely got hit today, but by design they risk a small percentage on each trade, typically around 0.25% of equity per position, allowing it to float higher when profits are in hand.But even with giving up profits and even with significant slippage beyond stops, this isn’t a death knell for Trend. Painful, but not catastrophic. The portfolio lives to trade another day.
Days like today separate the systematic from the speculative, the professionals from the punters. Trend followers will regroup, adjust positions, and continue executing their process. They’ve seen days like this before and they’ll see them again. Their risk management isn’t designed for the good times, it’s designed for exactly this.


