
Now that the dust has settled a bit after a topsy, turvy April – it’s time for a check in on the Volatility space.
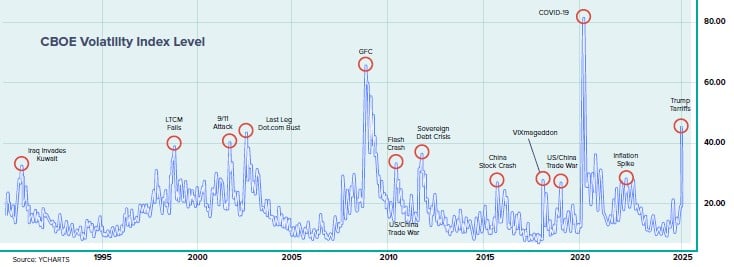
With the S&P down -12% MTD and -19% from it’s highs at one point, and the VIX hitting 52; April was crazy enough that we added a new VIX peak to our VIX spike chart in our updated VIX/VOL whitepaper… [download here]
And it left many investors wondering out loud – how do you protect against wild, social media driven volatility spikes like these…
Forbes was bumping up against this in a mid-April article which featured Chicago firm, Vol trading, Derivative podcast appearing… Equity Armor, saying:
For investors wanting to smooth out stocks’ rockiness in a single fund, some firms blend volatility protection with a more diversified portfolio of stocks. Chicago-based Equity Armor Investments manages $171 million in assets in funds like its Rational Equity Armor Fund (HDCTX), which invests primarily in dividend-paying companies in the S&P 500 and also invests up to 20% of its assets in VIX futures contracts. It has a model to determine which options are cheap or expensive and avoid the natural decay associated with rolling VIX options, says co-portfolio manager and chief trading officer Joe Tigay. He portrays the fund as an alternative to balanced 60/40 portfolios, now that bonds haven’t acted as a hedge on stock exposure this year the way they often have in the past.
Tigay says the fund typically has about 15% of its assets in its volatility strategy and 85% in stocks, and that can vary depending on the market. When the VIX spikes, the fund can move some of its profits from those options into stocks to smooth out the return, and when stocks rise, VIX futures in turn get cheaper. That helped make its maximum drawdown in 2020 a 15% loss, when the S&P 500 crashed 34%. Its five-year annualized return of 7.1% underperforms the S&P 500’s 14% mark, but beats the Morningstar Moderately Conservative risk index it benchmarks to by three percentage points. So far in 2025, it’s down 4.8%.
“When there’s a lot of volatility, it’s not scary, it’s actionable, and it allows us to maneuver in the market,” says Tigay. “It’s a built-in sell-high, buy-low strategy.”
So how do you find manager’s like Equity Armor that make volatility “not scary, [but] actionable” As the old saying goes… there’s a podcast for that. Well, actually, we don’t know of any saying like that. But, there IS a podcast for that. We’ve highlighted dozens of volatility traders on the Derivative podcast over the years… and this was perhaps their first real test since the Covid vol spike. We had a mini spike in Aug last year, and 2022 was a test of a different kind – a slow crawl lower.
So how did several of the vol pros we’ve had on the pod perform in April… here you go…
Past performance is not indicative of future results.
| PROGRAM | APRIL RoR | DESC. | PODCAST |
|---|---|---|---|
| LongTail Alpha *OneTail Hedgehog Fund II, L.P | +17.86% | Tail Risk | Taming the Tails with LongTail Alpha’s Vineer Bhansali |
| DeepField Capital | +10.21% | Equity Index Day Trading | Intraday trading and market moves, with Bastian Bolesta |
| Zero Delta | +3.03% | Fund of Vol Traders | Volatility Vultures: Hunting for Options Talent with Gary Selz |
| Mutiny Funds Volatility + Stocks | +2.69% | Volatility + Stocks (2x S&P + 2x Long Vol) | |
| *Convexitas Tail Liquidity | +2.55% | Discretionary Options + Long Gamma | Protecting the Portfolio with Long Gamma, with Convexitas |
| Mutiny Funds Volatility | +2.35% | Volatility Strategy (Relative Value, Long Options, +Tail Risk) | |
| Breakout Funds | +1.03% | Short Term Macro | The Life of a Discretionary Trader with Breakout Funds’ |
| 36 South | +1.01% | Long across Asset Vol | Teams of Options to Tackle the Tails with Jerry Haworth |
| Mutiny Funds Cockroach | +0.67% | Cockroach Strategy (Total Portfolio Approach) | Constructing a Cockroach (Portfolio) with Mutiny Funds |
| Equity Armor (HDCTX) | +0.43% | SP+VIX | Talking market shocks and VIX spikes with Brian Stutland |
*From manager estimates and RCM analysis
*Convextias only provides securities-based strategies and is not registered with the NFA
