If you took a quick glance at the futures markets year to date on Finviz lately, one might think that trend followers would be giddy over the current market situation; there’s the long trend in Nat Gas (although down significantly over the past few days), Coffee is coming out of nowhere up 20% YTD, Sugar’s is in a textbook drawdown, and Cattle’s up around all time highs {past performance is not necessarily indicative of future results}. Not only that, but the S&P is down around 5.5% for the new year (after shedding -2% as of now…today), and this is starting to feel a little bit like one of those classic crisis period investments managed futures is known for (although being down 5% isn’t quite a crisis).
So why in the world did managed futures finish down in January, with the Newedge Trend Follower sub-Index down an even worse -4.09% {past performance is not necessarily indicative of future results}. Isn’t this what we have them sitting around for – to perform during a down move in US stocks?
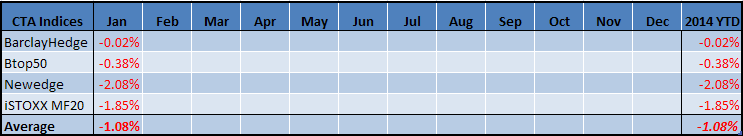 (Disclaimer: Past performance is not necessarily indicative of future results)
Not so fast my friends… managed futures are non-correlated with the stock market – not negatively-correlated. For more than you want to know on correlation and this distinction, see the newsletter we pulled the following quick explanation out of:
NON Correlation does not equal Negative Correlation
The problem most investors (and those writing how managed futures are unexpectedly struggling while stocks are as well), is that they are usually sold on managed futures via the argument that they are NON-correlated with stocks and bonds (which they are), but shown an example of NEGATIVE correlation to support the argument.
The example most investors are shown of managed futures NON correlation to stocks is 2008, when the ability of managed futures to put in gains of 13% that year while stocks were down -38% became the stuff of legend [past performance is not necessarily indicative of future results]. Problem is – that example is not of NON correlation, it is of NEGATIVE correlation. The average 3 month rolling correlation between August and December 2008 was a very negative -0.91!
So, the 2008 poster child for managed futures NON correlation is actually an example of NEGATIVE correlation – oops. This no doubt leads to an expectation mismatch amongst many investors where they believe managed futures should perform the same way during each and every stock market down turn (like May or June). They have been led to believe NON correlation equals NEGATIVE correlation, but it means anything but. They want NEGATIVE correlation, but they have NON correlation.
NON correlation means random meandering back and forth between POSITIVE and NEGATIVE correlation (like the rolling 3mo correlation chart above). Investors are down there on the river encountering those bends in real time, sometimes pointing in the direction of POSITIVE correlation with stocks, other times in the direction of NEGATIVE correlation.
Bottom line? There can and will be times where managed futures loses money alongside of stocks, because NON-correlation does not equal NEGATIVE correlation.
So those expecting managed futures to be doing well right now aren’t quite getting the distinction above. For one, this is hardly a crisis. You see, when we talk about crisis period performance for managed futures, we’re talking about periods longer than a single day, week, or even month. We’re talking about periods in which traditional investments see major shifts (2007 to 2008 is the classic example, when stocks and commodities fell over several months).
In our opinion, crisis periods have two parts. One is the crisis itself, which usually causes a reversal of the current market trend (in this case current trend was stocks, foreign currencies, commodities up; bonds and US Dollar down). The second part is the aftermath of the crisis in which new market conditions and trends emerge. Managed futures generally outperform during the second part of the crisis, and may or may not perform during the first part. The thing is, traditional investments usually underperform in both parts – suffering during the crisis itself, and then continuing to struggle with their long only bias.
The immediate problem for managed futures now is that the existing trend most were involved in was UP in stocks, and DOWN in some foreign currencies (the Yen) and Bond markets. These trends are now being broken (or were broken in Jan), causing losses on the existing positions in those trends. Now, whether this turns into a full blown crisis for stocks remains to be seen, but that is when managed futures (generally speaking) will enter into new trades to capture the downtrend – and that is when they will become negatively correlated to stocks…and should the markets continue lower from there – that is when we’ll see managed futures shine as a crisis period performer.
Until then, managed futures will be licking some wounds like the rest of the world’s investors, unfortunately; although the other market trends could keep them doing better.