5 Reasons This Crude Move is Unbelievable

It’s been one amazing sell off in Crude Oil; so amazing we can’t stop writing about it. We’ve covered the long term picture of Crude, The Best Tweets from Crude’s Drop, How to Play a Bounce , and everyone else’s  articles on crude. But we can’t stop staring at it… We’re the commodity focused moth to the proverbial flame.

But why is this sell off so amazing? What’s special about it?

1.  The sheer velocity. How incredibly steep and unrelenting this down trend has been, for starters:

Crude Oil Bloomberg(Disclaimer: Past performance is not necessarily indicative of future results)
Chart Courtesy: Ed Conway

2. The numbers. If statistics are more of your thing – this highlight reel from the sell off which began last July might leave you in some technical amazement:

  • Biggest Daily Drop = -10.53% on Black Friday (November 28th)
  • Down 81 of 135 days since July 1 (60% of days), 41 of 71 days since Oct 1  (62% of days),
  • Its average day has been down –0.60% since July 1, down -0.92% since Oct 1st.
  • It’s fallen -1.78%, on average, when having a down day since July 1st,  down -2.26% since Oct 1st.
  • Down over -1% in a day 37% of the time (versus 22% in the previous 5 years)
  • Down over -2% in a day 18% of the time (versus 9% in the previous 5 years)
  • Down over -3% in a day 11% of the time (versus 3% in the previous 5 years)
  • Current Price is 29% below the 50 Day Moving Average, 40% below the 100 day, 49% below the 200 day.
  • Is the largest difference between current price and 100 day moving average in 6 years

3. The size of this market. Part of the amazement is because of how big of a market this is, especially in the financial world, where Oil is one of the most financialized things us humans have ever come up with, where Oil futures volume represents about 500 million barrels per day, about 5 times the 100 million barrels a day that are actually produced.  Some say prices are were high because of this financialization. You be the judge on that one…

Crude Price vs Volume(Disclaimer: Past performance is not necessarily indicative of future results)

4. How wrong everyone was. A very, very big part of the amazement is how so many people could have completely missed this move, given how interconnected Crude is to the world economy.  As a whole, the energy markets sold off big time… Crude Oil (-49%), Gasoline (-52%), and Heating Oil (-38%) in 2014. How could these markets, which account for the economies of whole countries like Russia and whole regions like the Middle East, which hundreds of billions of corporate revenues are based on, and which are traded by professional speculators, producers, and big commodity players day in and day out; lose over half their value in just six months? How could millions of people involved in Oil’s discovery, production, refining, accounting, drilling, transport, etc, etc. etc – not be waving warning flags back in June that prices were about 2x too high? How could hedge fund titans like John Paulson who correctly bet on the housing collapse in 2008 not foresee such a move in a market like Crude Oil when much smaller players were able to?

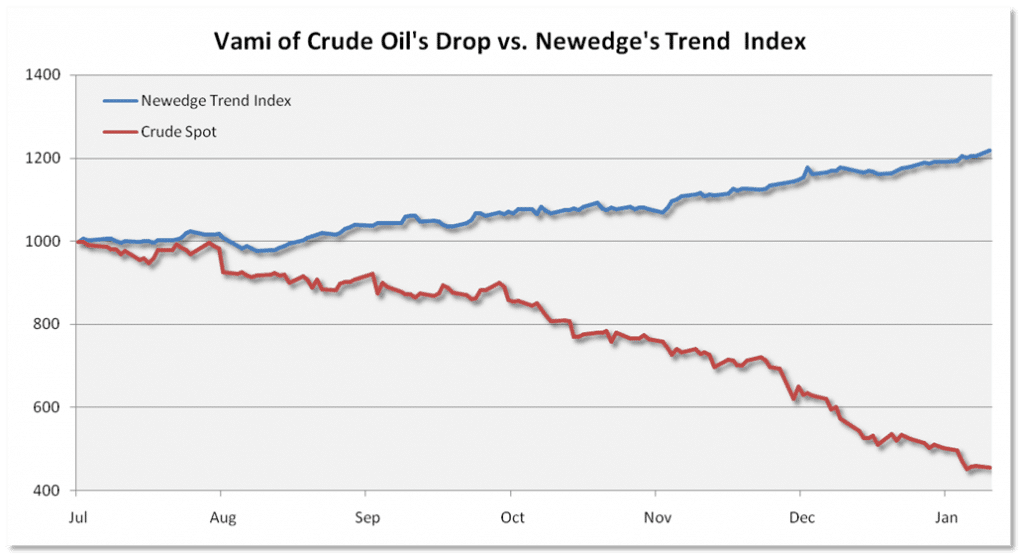
5. How not everyone was wrong.  Of course, not everybody was “wrong” on Crude Oil. Systematic trend following strategies got it “right,” although the managers and quants who develop and run the models would likely never say they were wrong or right on a market. They wouldn’t boast about being right, or admit to being wrong; because they aren’t guessing or predicting where a market will go. They are following.  So their success in Crude Oil wasn’t from correctly “calling” this trade over the past few months, it was from implementing a model and trading methodology which would capture such a move (in Crude, and Corn, and Euro Bunds, and dozens more) when and if it happened.  It’s a little hard to wrap our heads around, but the success trend followers are enjoying right now isn’t from actions taken now – it’s from actions taken years ago.  The reward isn’t from risks taken on this trade, it’s from risks taken on dozens of trades previously. Anyway, we’ll quit waxing philosophical… and show you just how similar (albeit in opposite directions) the trends in Crude and Trend Following performance has been over the past six months.

Crude vs Newedge Trend Index(Disclaimer: Past performance is not necessarily indicative of future results)
Source: Newedge
Data through Jan 12th, 2015

To learn more about Trend Followers, download our free Whitepaper of Trending Following. We break down how trend followers identify both when a trend begins and ends, and explain why not all trend followers are the same.


One comment

  1. When Russia has been sufficiently punished for invading Crimea and Ukraine, your jaw will hit the floor as you watch the miraculous escalating rebound in oil and gas prices. And you can bet that all those ‘in the know’ will already have loaded up on all the right oil tickers.

Write a Comment

Disclaimer
The performance data displayed herein is compiled from various sources, including BarclayHedge, and reports directly from the advisors. These performance figures should not be relied on independent of the individual advisor's disclosure document, which has important information regarding the method of calculation used, whether or not the performance includes proprietary results, and other important footnotes on the advisor's track record.

The programs listed here are a sub-set of the full list of programs able to be accessed by subscribing to the database and reflect programs we currently work with and/or are more familiar with.

Benchmark index performance is for the constituents of that index only, and does not represent the entire universe of possible investments within that asset class. And further, that there can be limitations and biases to indices such as survivorship, self reporting, and instant history. Individuals cannot invest in the index itself, and actual rates of return may be significantly different and more volatile than those of the index.

Managed futures accounts can subject to substantial charges for management and advisory fees. The numbers within this website include all such fees, but it may be necessary for those accounts that are subject to these charges to make substantial trading profits in the future to avoid depletion or exhaustion of their assets.

Investors interested in investing with a managed futures program (excepting those programs which are offered exclusively to qualified eligible persons as that term is defined by CFTC regulation 4.7) will be required to receive and sign off on a disclosure document in compliance with certain CFT rules The disclosure documents contains a complete description of the principal risk factors and each fee to be charged to your account by the CTA, as well as the composite performance of accounts under the CTA's management over at least the most recent five years. Investor interested in investing in any of the programs on this website are urged to carefully read these disclosure documents, including, but not limited to the performance information, before investing in any such programs.

Those investors who are qualified eligible persons as that term is defined by CFTC regulation 4.7 and interested in investing in a program exempt from having to provide a disclosure document and considered by the regulations to be sophisticated enough to understand the risks and be able to interpret the accuracy and completeness of any performance information on their own.

RCM receives a portion of the commodity brokerage commissions you pay in connection with your futures trading and/or a portion of the interest income (if any) earned on an account's assets. The listed manager may also pay RCM a portion of the fees they receive from accounts introduced to them by RCM.

Limitations on RCM Quintile + Star Rankings

The Quintile Rankings and RCM Star Rankings shown here are provided for informational purposes only. RCM does not guarantee the accuracy, timeliness or completeness of this information. The ranking methodology is proprietary and the results have not been audited or verified by an independent third party. Some CTAs may employ trading programs or strategies that are riskier than others. CTAs may manage customer accounts differently than their model results shown or make different trades in actual customer accounts versus their own accounts. Different CTAs are subject to different market conditions and risks that can significantly impact actual results. RCM and its affiliates receive compensation from some of the rated CTAs. Investors should perform their own due diligence before investing with any CTA. This ranking information should not be the sole basis for any investment decision.

See the full terms of use and risk disclaimer here.

logo