Are Alternative Mutual Funds eating from the CTA Pie?

It seems like everywhere you look, you see a chart showing the upward AUM growth of liquid mutual funds, as well as the number of new funds. These charts left us with one main lingering question that we think is on the mind of many in the Managed Futures space. How big is the Liquid Mutual fund compared to the rest of the industry? And is that growth in addition to, or at the expense of, the rest of the industry?

We explored this question in the latest article featured in CTA Intelligence, seen below.

Are alt mutuals eating from the CTA pie?

There’s no doubt that the packaging of managed futures into liquid mutual funds (’40 Acts’ as they’re called in the biz) has changed the managed futures space forever. It just depends which side of this particular aisle you’re on whether you view that as a good or bad change. On one hand, you can argue the $11bn AQR which has been brought into the space is good for the industry (in a sort of rising tide lifts all boats argument). On the other hand, there were the snickers and jeers in the audience at last year’s managed futures Pinnacle Awards when Cliff Asness won a lifetime achievement award. Many said he should have won the lifetime damage award for undercutting everyone on fees and essentially switching $11bn in money from 2/20 to 125bps).

So which is it? Are managed futures mutual funds good for the industry as a whole? This may all seem like semantics, but it is surely important for those playing their particular brand of managed futures to investors.

If mutuals are grabbing assets at the expense of others, then that’s surely not helpful to the grand majority of fund managers out there, not to mention the exchanges, brokerage firms, and the rest of the industry which need new money brought into the space to grow, not just the same money switching to mutual funds. Which brings us to the numbers. We gathered the data on the assets in managed futures mutual funds to trace the growth of the category since 2013. Then, we looked to compare that growth to the growth of managed futures as a whole from the BarclayHedge database.

Now, a few details to consider:
 One, we made one big assumption, that all of the managed futures mutual fund AuM is included in the BarclayHedge CTA database, to make the math as simple as subtracting the ‘liquid AuM’ from the BarclayHedge AuM to arrive at the ‘non-liquid AuM’. Second, we subtracted Bridgewater’s AuM from the BarclayHedge numbers (we don’t consider them to be managed futures). And finally, we’re talking growth of assets here and sort of commingling that with inflows and outflows, as that term is known in the mutual fund world.

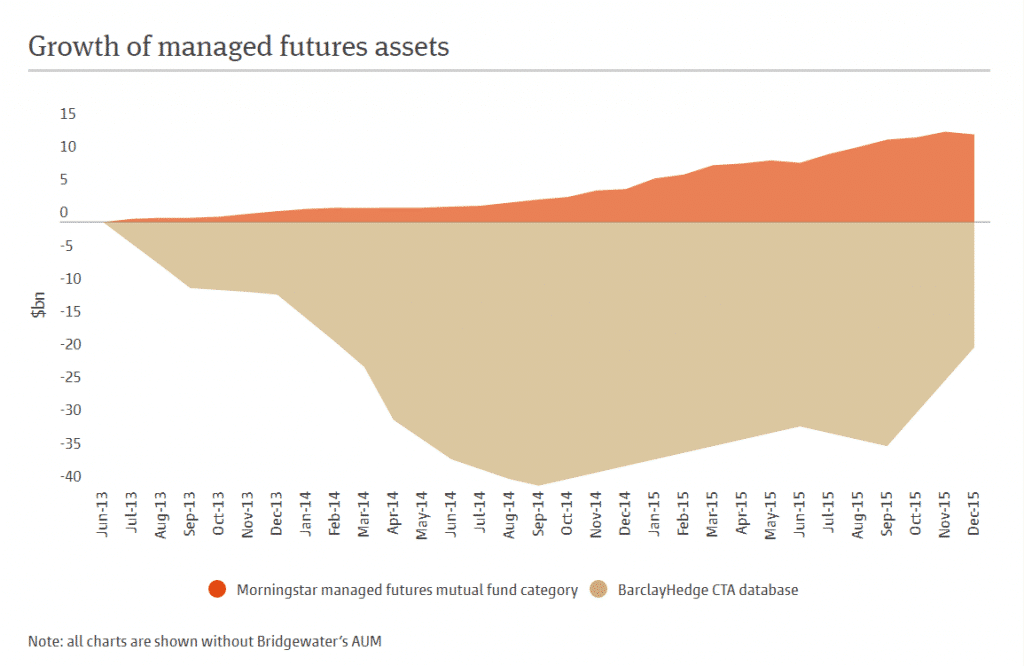
Our methodology is considering the change in assets, so the growth or decline is both inflows/outflows and performance. As for what we would anticipate to see if there’s a rising tide effect, we would expect both curves to be up varying amounts.

If there is ‘liquid’ growth at the expense of private funds, we would expect sort of mirror image curves, with private on the bottom and liquid on top. So what did we find – more of the mirrored look, albeit with private funds more mirrored than just mutual funds would explain – meaning they didn’t lose a dollar in assets for every one mutual funds brought in – they appear to have lost more. Going with BarclayHedge numbers, private funds lost around $40bn in assets through the middle of 2014 before pulling in around $20bn to end the period down roughly $19bn. Meanwhile, their liquid alt counterparts showed a slow but consistent growth of around $13bn over two years (amazingly, AQR was about $7.5bn of that amount according to Brightscope). All in all, the managed futures mutual funds in the Morningstar managed futures mutual fund category outgrew private funds by $33bn.

Growth of Managed Futures Assets

This is interesting but it doesn’t completely answer the question we are after. Growth in assets are a good indicator of which vehicle investors are adding or subtracting from, but it doesn’t quite tell us how much of the industry is controlled by each type.

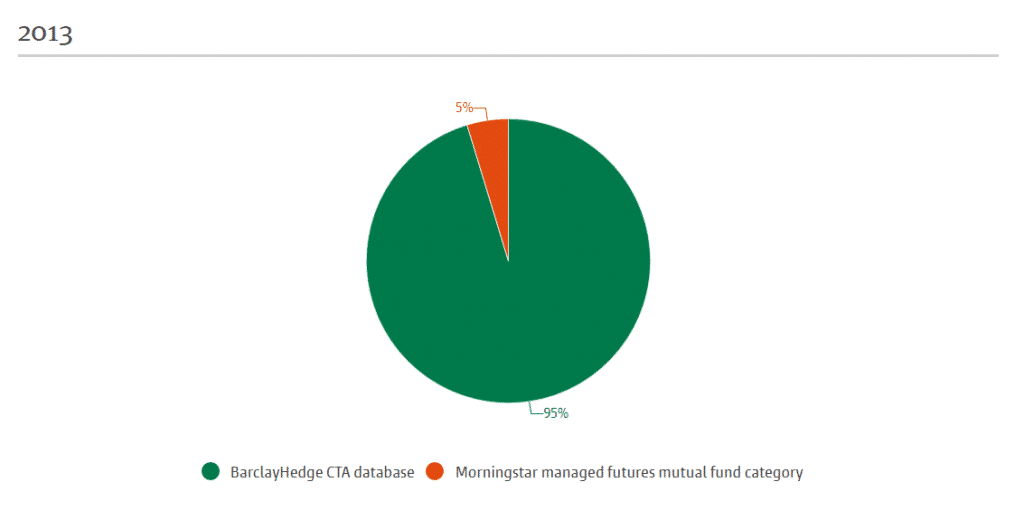
Here’s a look at the percentage of managed futures assets controlled by mutual funds compared to the amount that is not. In 2013, our estimation of the total assets in managed futures through both private and liquid funds was about $206bn. The Morningstar category had around $9.6bn of that number, meaning 4.7% of the managed futures pie was controlled by mutual funds (cue pie chart):

2013 Managed Futures AUM Pie
2015 Managed Futures AUM Pie

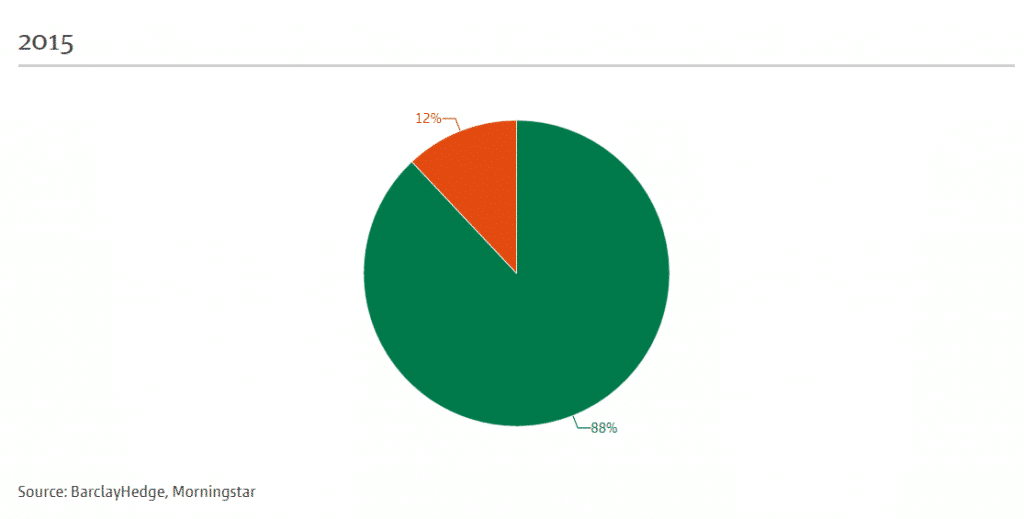
Fast forward to 2015, and we estimate managed futures overall actually went down in AuM by about $8.1bn to $198bn, while mutual funds grew by $13.9bn over the same time to a new high of $23.7bn, meaning managed futures mutual funds now represent 12% of the industry.

The last two years have seen mutual funds share of the managed futures pie jump from 4.6% to 12%. That’s sort of impressive, but not as big of a jump as we might have thought before crunching the numbers.

Perhaps, it’s important to apply context to what was going on during this growth. Managed futures was experiencing its worst drawdown in a generation throughout 2013 and the first half of 2014, then following it up by posting its best performance since 2008 in the second half of 2014.Grabbing a bigger slice of the pie with what’s generally considered ‘hotter’ money investing in mutual funds is certainly a feat. There’s no denying mutual funds are making up more of the managed futures space, but private funds still control

There’s no denying mutual funds are making up more of the managed futures space, but private funds still control nine tenths of AuM – that’s a big number. The question is, what does the future trajectory look like? You would think mutual funds would continue making hay and taking a bigger and bigger slice of the pie, and indeed more and more managers we talk to are asking when, not if, they should consider switching to a mutual fund format.

But then there are reports that institutional investors are looking to increase their exposure to private funds in 2016.

And last but not least, it’s not a wide open road ahead for liquid alts products with new SEC derivatives rules on the horizon, potentially meaning you would need millions of dollars to trade a single Euro Dollar future, effectively putting the managed futures mutual fund complex out of business.

Stay tuned…this is one battle definitely worth watching

One comment

  1. […] Mutual funds are encroaching on the CTA space. (managed-futures-blog.attaincapital) […]

Write a Comment

Disclaimer
The performance data displayed herein is compiled from various sources, including BarclayHedge, and reports directly from the advisors. These performance figures should not be relied on independent of the individual advisor's disclosure document, which has important information regarding the method of calculation used, whether or not the performance includes proprietary results, and other important footnotes on the advisor's track record.

The programs listed here are a sub-set of the full list of programs able to be accessed by subscribing to the database and reflect programs we currently work with and/or are more familiar with.

Benchmark index performance is for the constituents of that index only, and does not represent the entire universe of possible investments within that asset class. And further, that there can be limitations and biases to indices such as survivorship, self reporting, and instant history. Individuals cannot invest in the index itself, and actual rates of return may be significantly different and more volatile than those of the index.

Managed futures accounts can subject to substantial charges for management and advisory fees. The numbers within this website include all such fees, but it may be necessary for those accounts that are subject to these charges to make substantial trading profits in the future to avoid depletion or exhaustion of their assets.

Investors interested in investing with a managed futures program (excepting those programs which are offered exclusively to qualified eligible persons as that term is defined by CFTC regulation 4.7) will be required to receive and sign off on a disclosure document in compliance with certain CFT rules The disclosure documents contains a complete description of the principal risk factors and each fee to be charged to your account by the CTA, as well as the composite performance of accounts under the CTA's management over at least the most recent five years. Investor interested in investing in any of the programs on this website are urged to carefully read these disclosure documents, including, but not limited to the performance information, before investing in any such programs.

Those investors who are qualified eligible persons as that term is defined by CFTC regulation 4.7 and interested in investing in a program exempt from having to provide a disclosure document and considered by the regulations to be sophisticated enough to understand the risks and be able to interpret the accuracy and completeness of any performance information on their own.

RCM receives a portion of the commodity brokerage commissions you pay in connection with your futures trading and/or a portion of the interest income (if any) earned on an account's assets. The listed manager may also pay RCM a portion of the fees they receive from accounts introduced to them by RCM.

Limitations on RCM Quintile + Star Rankings

The Quintile Rankings and RCM Star Rankings shown here are provided for informational purposes only. RCM does not guarantee the accuracy, timeliness or completeness of this information. The ranking methodology is proprietary and the results have not been audited or verified by an independent third party. Some CTAs may employ trading programs or strategies that are riskier than others. CTAs may manage customer accounts differently than their model results shown or make different trades in actual customer accounts versus their own accounts. Different CTAs are subject to different market conditions and risks that can significantly impact actual results. RCM and its affiliates receive compensation from some of the rated CTAs. Investors should perform their own due diligence before investing with any CTA. This ranking information should not be the sole basis for any investment decision.

See the full terms of use and risk disclaimer here.

logo