
The last month and a half has been one crazy ride for an asset class that prides itself more on base hits than trying to hit home runs. It started off with a bang, at one point up about 6% (per the SG CTA Index) as many in the industry headed down to Miami for the annual spate of conferences, broad smiles on their faces. It prompted us to write how it could be the best monthly performance from Managed Futures in more than a decade on January 29th – which, as often happens, put the nail in the coffin for the up move in a cruel contrarian headline sort of way. The market(s), it turned out, had other plans, with several key reversals causing the SG CTA Index (which is made up of the top 20 CTAs excluding Winton) to tumble at the end of January into the first week of February. In the course of 13 days, the index went from up 6% to down -4.5%, a 10% swing. That’s surprisingly similar to what stocks have done so far in 2018.
 (Disclaimer: Past performance is not necessarily indicative of future results)
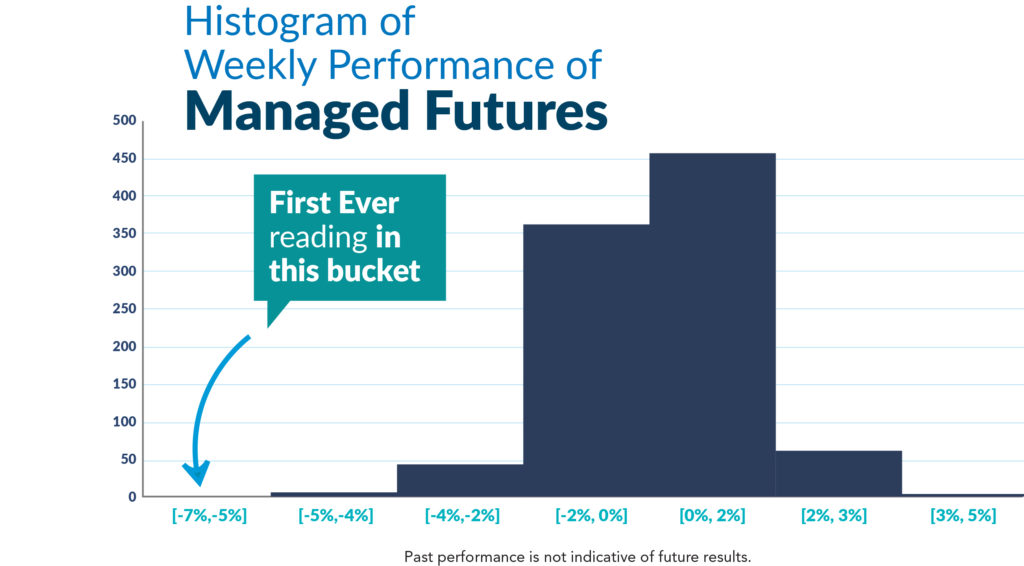
We looked back at the data, and it turns out last week was the single largest weekly drop in the SG index, down -7.04% in five days. Moving past the significance of this short term correlation to equities (remember, non-correlation does not equal negative correlation), we wanted to know how often this sort of volatile move happens in the CTA Index. To find out, we looked back at weekly data to the year 2000, and found that last week really was an outlier to the downside. We found that just 13 out of 945 weekly periods were below -3%, just 6 below -4%, and just 3 below -5%. And until last week – there were none worse than -6%.
(Disclaimer: Past performance is not necessarily indicative of future results)
Why the bad week for an asset class that has been known for its crisis period performance Well, part of it may be what we noted in two different parts of our annual Managed Futures Outlook:
….beware the managed futures programs who have ‘cheated’ a little over the past few years to get additional return by adding short vol/long equity biased exposure to their models. They’ve been smarter than their peers for doing so the past few years, but may underperform should we see a more normal equity/vol pattern.
And indeed, while the reversal in equities was quite sharp – the reversal in one of managed futures favorite markets (bonds) wasn’t really there, showing us the losses were thanks in large part to the equity reversal:
Of interest today… no real flight to safety in bonds.
Is this what a higher rates induced sell off looks like?
What happens to crisis risk offset portfolios, not to mention good ‘ol 60/40, when bonds go down WITH stocks… pic.twitter.com/iZHrK6gZPg
— RCM Alternatives (@rcmAlts) February 8, 2018
So will managed futures keep tracking stocks? That’s doubtful, given their risk control and design which essentially stops them out of losing positions. Here’s JPM’s Kolanovic on the current positioning of CTAs:
Now this is an interesting situation: signals are positive on equities, but many CTAs may be actually out of equities or have significantly reduced their exposure. As volatility declines, they will need to add equities on account of their risk control, and may need to more quickly re-engage positive equity signals on account of going out of the stop-loss lookback window. Even if the stop loss story is not universal, keep in mind that we held the 200d MA, and we now positively crossed the 3M signal, so for those that didn’t have a stop loss, the market’s move higher may trigger incremental buying.
Bottom line – I think CTAs are a moderate risk on the upside, not downside.
Volatility targeting strategies still have some exposure to sell, but that may be winding down over the next few days.
Risk parity was always more important for selling bonds than for equities, they are generally slow (ex vol targeting) so I don’t think that’s a significant risk forst stocks. There is also upside risk of pension fund rebalances, who need to buy back >5% of equity exposure (given most on those on fixed weights rebalanced right at the top).
Of course, it wasn’t all stock exposure. Metals and energy markets need to shoulder some of the blame as well. From our viewpoint, long equity exposure has definitely been lightened up, and those purely short vol have been removed from the game, for now. But the real lesson is that when everything is bid up, there’s only one way for that trend to end, with multiple non correlated assets seeing correlations rise as they reverse together.