
The days of sleepy summer headlines seem like a thing of the past lately. Everyone’s talking tariffs, retaliation tariffs, and trade war. What sort of impact is the threat of a trade war due to these tariffs having on markets? Not to be too cute… but that all depends on the market. There’s more than one market in the world of alternative investments. Some markets like stocks and currencies are treating the tariffs as rather binary events to be immediately bought or sold en masse, other markets like soybeans and metals seem to be letting it create a new market environment with different long-term price levels. Both types of reaction matter for investment models, quants, and traders.
Binary Tariff Moves = the bad sort of market volatility
In our Managed Futures / Global Macro 2018 Outlook, we touched on tariffs as one of the ways President Trump’s….shall we say, volatility, could impact markets:
And perhaps more so now that we’ve all been sort of lulled to sleep by the drama in Washington not having any effect on markets. But that’s not to say Trump threatening to pull out of something like NAFTA or placing tariffs on solar panels (predominately coming out of China) couldn’t cause a market reaction.
Bottom line, the more ultimatums and deadlines we see out of Mr. Trump, the more binary market movement could become – with prices moving quickly to meet the new reality instead of building into a new reality over time.
Our worry was that bluster coming out of the White House could spell trouble for systematic models, and it seems that this year’s numerous rounds of tariff threats have been doing just that from time to time. Take equities reaction to the Trump Administration adding a third round of tariffs on China (at around $200 Billion) a few days ago.
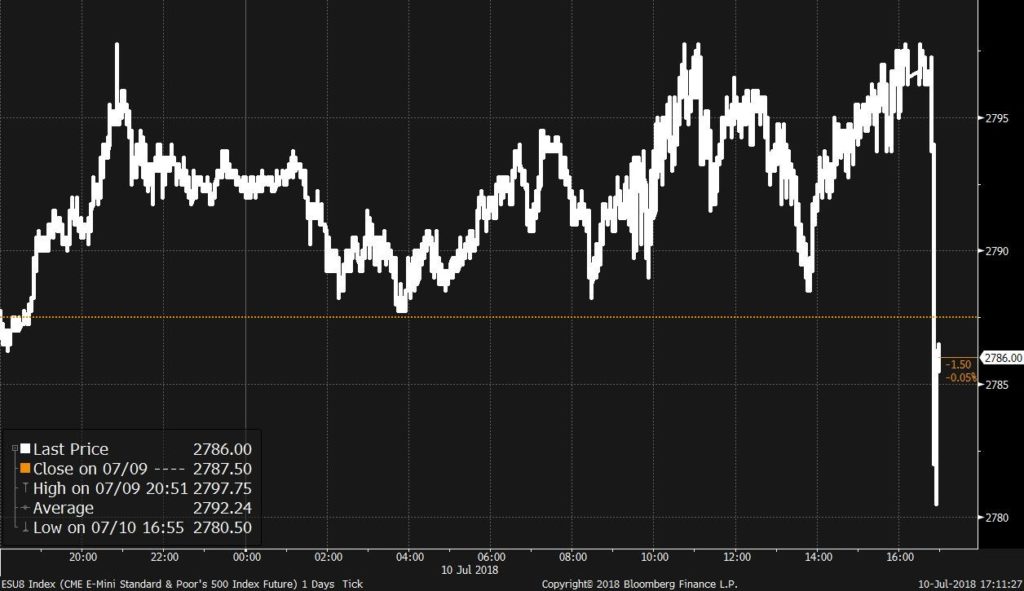
Before we put the cart before the horse, this is an hourly chart, only showing the market movement over a 24-hour period, where only one day of gains were erased. This on top of the market rebounding 90 basis points two days following. In the grand scheme of things, this move isn’t all that significant, but it does highlight the type of binary market moves that make it difficult for systematic trading models to react. These binary moves tend to stem from ultimatums, deadlines, out of the blue directives, and so on which can spike markets quickly – creating the volatility we all (mostly) want, but with that spike not necessarily being the beginning of a secular move higher/lower, of directional volatility.
This is the pinnacle of frustration for systematic programs which are designed to capture outlier moves. But with binary events like the Swiss Franc, Brexit, and even the VIX Feb spike, the outlier move happens all at once in a sort of uncapturable way (for most). Most systematic models are designed to measure averages and ranges and model risk and reward based on previous patterns and data to identify potential outlier moves being generated over time. They aren’t looking for the outlier move to happen all at once. The type of outlier moves they look for are more like combinations of normal moves pushing prices to new highs or lows.
Imagine flipping a coin. Systematic models are setup to capitalize on an outlier event such as the coin being flipped heads 20 times in a row, risking, say… $0.25 to earn $5.00 in profit (a quarter for every correct flip). The binary events are like changing the game, saying we’re going to risk $20 on the next coin flip, and then not play anymore.
As we said in our 2018 outlook – the more ultimatums and deadlines we see out of Mr. Trump, the more binary markets could become – with prices moving quickly to meet the new reality instead of building into a new reality over time. So far, President Trump has threatened or placed tariffs on China, Mexico, Canada, and the EU. But we’re not as worried in this space that it will cause a string of market losses or significantly higher/lower prices in different assets – we’re worried it will do so in a few hours instead of a few weeks.
Extended Tariff Price reactions = the good sort of market volatility
Here’s what a more normal reaction to a trade war and tariffs looks like. Trump’s spat with China causing them China to raise prices on U.S. Soybeans imported to their country by 25%, which is pushing the futures price of US Soybeans so low it’s created a new price environment over the last several weeks. Buyers and sellers are agreeing, in essence, that the price should be significantly lower.

Now consider that Soybeans is the second largest financially important crop in the U.S., with $41 Billion with soybeans grown in 2017, with Corn coming in at $48 Billion. Now consider, China is the world’s biggest importer and America’s largest customer in a trade worth $14 billion last year. With these tariffs, China is turning to Brazil (the second largest soybean producer behind the U.S.) and removing their 3% soybean tariff on five over Asian countries, to eventually look to other areas instead of the U.S. But it’s not just soybeans, it’s also pork, milk products, and grains.
In interviews, Midwest farmers reveal the impact tariffs have already had, and the ones they fear are around the bend. In Indiana, pork producers say they’ve already been slammed by falling prices, starting when the trade war was just a rumor. In Wisconsin, cheesemakers say their overseas buyers are starting to look for new suppliers in order to avoid the tariffs. In Michigan, apple producers fear the fallout if states that do more exporting are forced to dump their product domestically.
If the tick to tack tariffs continue, this could be death by a million-paper cut situation models. It’s the risking $20 on one bet and not playing again situation. But the long-term effect could have lasting implications for U.S. soybeans farmers choose a different crop, or worse, can’t survive to make another crop the following year. This coming on a half a decade decline in soybeans prices from drought conditions:
The thing is, Trump’s not wrong about prices. Soybeans reached a record of $17.89 a bushel in 2012 and were down by more than 40 percent by the presidential election in November 2016. But that all-time high price came in the midst of a terrible drought in the U.S. Midwest that severely hurt crops. So, when prices came tumbling down, it was a typical market reaction to the end of a supply shock. Also driving the declines: farmers have been collecting bumper harvests in the years since the drought.
Either way, The American Soybean Association isn’t happy and have launched a campaign #FacesofTariffs to humanize how bad these tariffs are going to be for farmers in the Midwest. We could realistically be in a world where models and discretionary ag traders will have to start getting intel on how many farmers are still around to grow the crop. For now, soybean prices are tumbling and it doesn’t seem to have found a bottom.
Are Tariffs a Black Swan?
A quick side note on this whole trade war/tariff threat to the market(s). It’s surprising to see it move markets significantly of late when it has been out in the open and talked about for much of the past few months. The Black Swans made famous during the financial crisis were the unknown risks (even though many people, including these guys, were well aware of the problems). This is not an unknown risk. Indeed, it is actually a chief risk among global fund managers of late:

Which leads us to wonder, along with this Twitter user, whether the real black swan isn’t a trade war, but the lack of significant effects from a trade war:
The “black swan” nobody’s expecting is if all this resolves positively. Imagine the best case scenario – tariffs even lower than before, open reciprocal market access (no need for US business to have local partners in China, less avenue for tech transfer). Massive upsides.
— Gene Chan (@genejchan) July 11, 2018