
It seems like we’re working our way through the Ritholtz Wealth team’s posts recently, spending a bit of time on Barry’s views on disappearing Hedge Fund Performance, and then reading with interest Ben Carlson’s questioning post recently: “Is Real Estate a Non Correlated Asset Class?”. Based on the title alone, we were ready to pounce on the conclusions – knowing from our own experiences that it is anything but a diversifier in times of market crisis periods. But in the end, Carlson actually does a fair job of highlighting this and warning investors off using it as a tail risk hedge to stock heavy portfolios:
Investors say they want non-correlated assets but what they really want is non-correlated assets that don’t get crushed when stocks fall. REITs aren’t going to offer that type of protection because they are equity-like in terms of risk, volatility, and drawdown profile. If you’re looking for downside protection in real estate because it has higher yields, look elsewhere. From February 2007 through the end of February 2009 the Dow Jones REIT Index fell more than 70%. This tends to happen to risk assets when no one wants to take risk.
Don’t believe what he wrote? He’s got the stats to back it up, showing how volatile and non-consistent the rolling 3 year correlation between REITs and US Stocks has been over almost 40 years of history. It’s those high levels in throughout the 80’s and again during the financial crisis which are worrying from a “non-correlated” standpoint. To echo Carlson’s comments a bit – investors typical problem with non-correlated stuff is that it won’t always be a hedge. Many people confuse non correlation with negative correlation. Non correlation means an investment will do something different (on average), that’s all you know. That ‘on average’ part is the killer, as it means the correlation will sometimes be positive and sometimes negative, averaging out to around zero correlation (non correlated). Carlson’s graphic showing the Dow Jones REIT Index rolling three year correlation with the S&P 500 is a great example of this.
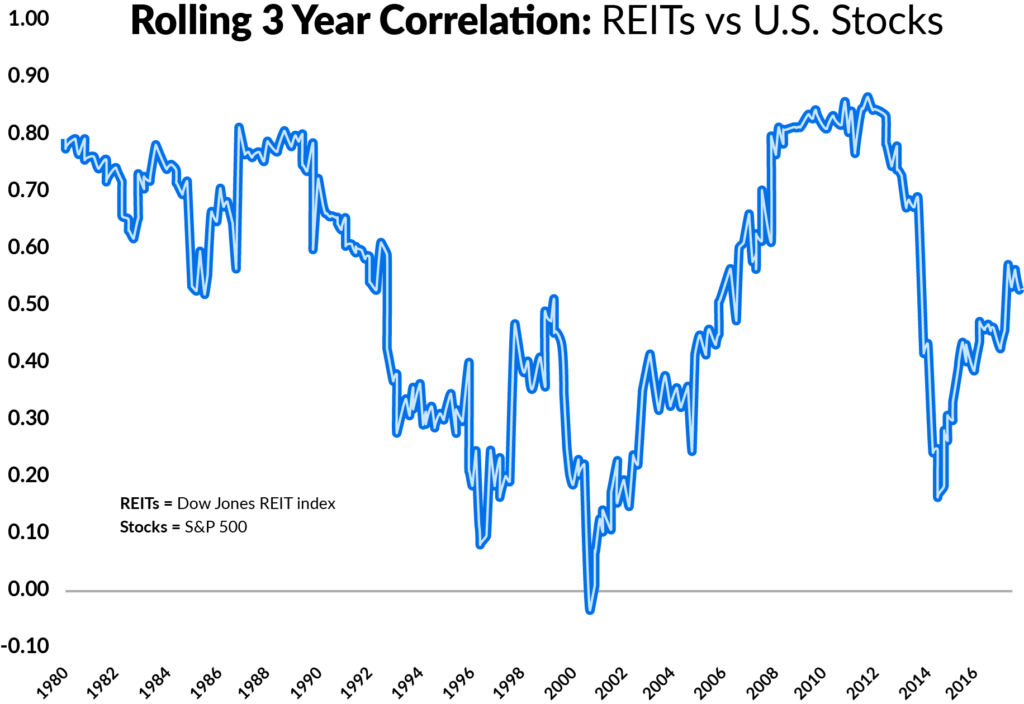
Eyeballing it, the average rolling correlation between real estate and stocks appears to be about 0.40 – which is technically probably more of low correlated. But you get the idea. Problem is, we don’t live in a world of averages. We feel pain in real time, not on a smoothed, average basis – so when our non-correlated investment becomes highly correlated over a short period of time, such as throughout the 1980’s in the chart above and again in the 2007 to 2009 period where the correlation reading was up in the 0.80 range (highly correlated), it’s at best frustrating – and at worst a disaster for the portfolio.
Why does this happen? Why does it swing from low correlation to high correlation. Differences in the timing of negative effects on the economy, for one. Just look at the current run of under performance for REITs, which has mainly been on the back of disappointing earnings and prospects for the future of retail in the US. That has hurt retail stocks, and you would think there would be a correlation between retail stocks going down and the overall market going down (bringing correlations to REITs higher). But because Amazon is, well, Amazon, with it’s market cap larger than the rest of the retail sector combined – n’s of the world have such large market caps – their gains at the expense of smaller retail shops (as represented by the REITs) has far outweighed the negative drag on a broad index of stocks caused by the retail sector. The timing aspect, is whether the Amazon success and subsequent retail sector pain will eventually result in overall economic pain, dragging down. The different between now and eventually can cause the differences in high versus low correlation, but make no mistake – they are both tied to the US Economy. Here’s Carlson, again:
The commercial real estate market is roughly the same size as the U.S. stock market. According to MSCI, almost $3 trillion of commercial real estate is professionally managed in the U.S. (worldwide that number is closer to $9 trillion).
So while real estate makes up only a small part of the stock market, it makes up a much larger portion of the overall economy.
Turns out, real estate is pretty closely tied to how the global economy is performing (turns out people need money to buy houses and keep paying their mortgages and buying stuff on Amazon, and such, and that the money comes from their jobs, which are sort of tied to how well companies are doing, which is sort of tied to how company’s future prospects are, which is what their stock price is based on.. in part). Yep – real estate is alternative right up until it isn’t – at which point it is highly correlated with the stock market. Going back to our infographic showing how different asset classes have performed over the past 5 stock market crisis periods, here’s how Real Estate has performed:
Real Estate Performance
During Stock Market Downturns
Source: Nareit All REITSs Index