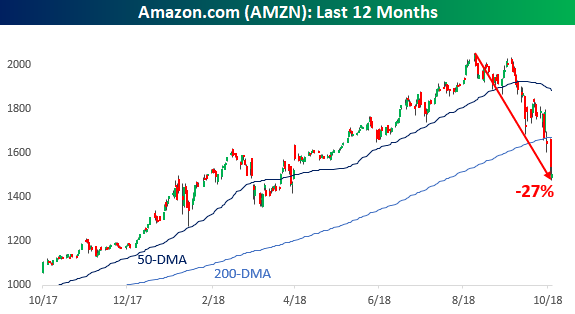
We can’t help but stare at the Amazon ($AMZN) charts this month in amazement. An investment down -25% over the case of a few weeks is generally seen as an unmitigated disaster. As a sign of big problems and a failing business. But while Amazon has shed a quarter of its Trillion dollar value recently (with Bezos personally losing a record -$20 Billion over two days), it’s still up by about 50% over the last 12 months and 10s of thousands of percent overall (and Bezos is still the world’s richest person), making Amazon and Bezos’ resulting wealth the mother of all outliers.
Amazon is widely considered one of the best investing success stories of all time, up 2,350% since the March 2009 low for a compounded annual return of about 40%. That’s good for doubling your money about every two years, per the rule of 72, making it among the most popular holdings of everything from mom and pop investors to hedge funds to mutual funds. But would these same sophisticated investors invest in this story if it weren’t a story at all. Would they invest based on the stats alone. There’s surely a lot to like from the return side. An Amazonian amount to like in terms of gains. But the risk side would send most (hedge fund) investors we know running for the hills.
What’s your Sharpe?
Most sophisticated investors don’t fall just for the story. They invest based on hard cold statistics, frequently failing to even look at an investment if it doesn’t clear some basic hurdles they’ve setup to separate the wheat from the chaff.
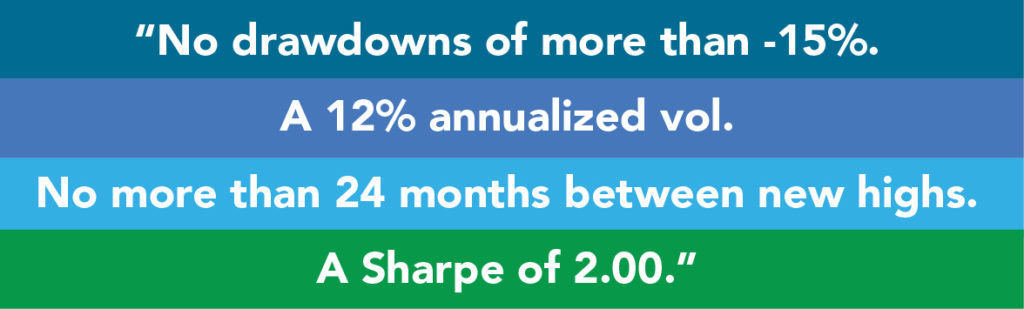
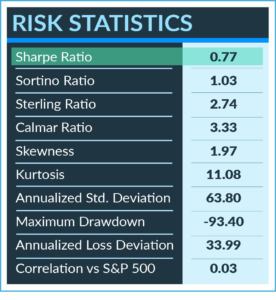
These are just some of the mandates and filtering mechanisms employed by sophisticated investors analyzing hedge fund strategies. And these are actually the more reasonable ones, there’s the 5.00 Sharpe, 30% returns with 5% drawdown fringe out there as well (who inevitably end up in premium selling programs which have yet to display their true risk yet, but that’s a story for another time). But our point is that the road to hell under performance is paved with good intentions stats. We entered the monthly Amazon stock percent returns into our online portfolio tool, and just look at some of the metrics hedge fund investors would use if analyzing Amazon’s stock ($AMZN) as if it were a hedge fund or commodity trading advisor program.
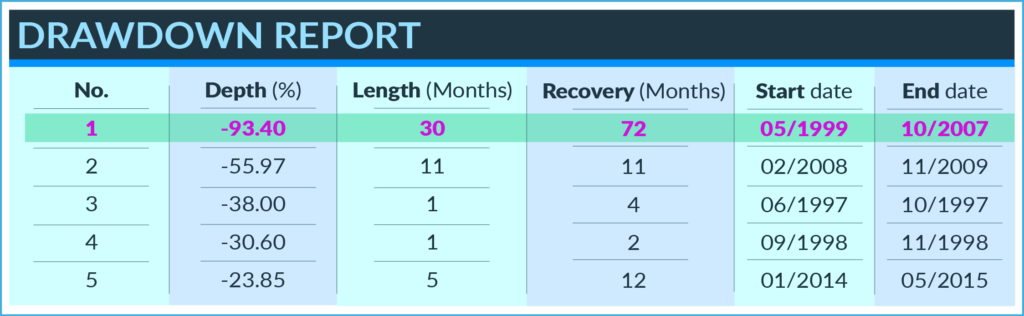
A max drawdown of -93% which took 72 months to recoup! Ouch.
Past performance is not indicative of future results.
An annualized volatility of about 64%! So long 12 vol.

Past performance is not indicative of future results.
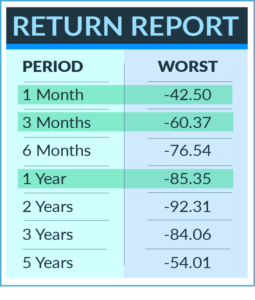
A worst month of -42%. Worst quarter of -60%, and worst year of -85%. Yelp, ouch, owww.
 Past performance is not indicative of future results.
And finally, a Sharpe ratio of just 0.77…boring.
Past performance is not indicative of future results.
Which is as good of a case against the Sharpe ratio (We’ve covered its many issues before, including here in ‘Sharpe Ratio: the black sheep of risk analysis’) as we’ve maybe ever seen.
But all of this is to say, you don’t get Amazonian type returns without the corresponding risk. There’s no free lunch (or soup). Which leads us back to not just the current levels in the stock market, but also alternative investments – which have shown the non-attractive side of non correlation of late by going down at the same time as stocks. Which brings us all the way back to the old conversation about getting in at the highs and out at the lows. How many investors do you think got out at some point in Amazon during one of those big down drafts saying the environment was wrong for the company, it’s underperformed x, y, or z asset class, and thousands of other reasons. More than a few, to be sure. And which investors stayed in? Those who had a long term view. Those who believed more in the vision of the company than the stock performance.
What investments are out there right now sitting at a similar spot? There’s surely some unloved stocks which might fit the bill. And there’s more than a few alternative investments. Commodities anyone? Managed futures… your global macro hedge fund? Where’s the Amazon equivalent of those underperformers? Where’s the innovation and research focus that you believe will be a long term success? There’s an Amazon out there somewhere – go find it!