
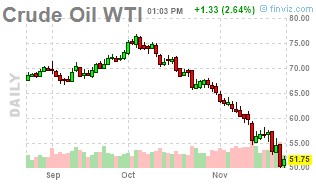
It’s been no secret that Alternative investments haven’t provided on their promise of diversification during the recent sell off in equity markets (even if that promise is based on providing non-correlation, not negative correlation at each down turn). The excuses are mostly valid – in that the sell off was a reversal of an up move. But there are trends now happening to the down side, like this rather classic looking down trend in Crude Oil:
So where are the returns from this oil move? Where is the diversification inside of systematic models? Have managers caught this move while being whipsawed elsewhere? The answer is more complicated than it may first appear, and is basically an answer of yes and no. Some have caught the down trend, while others have not. There’s more than a few ways to identify when an up trend ends and a down trend begins, and whether your particular brand of trend following is concocted using more short term models or longer term ones is the main determinant for whether you’ve been able to capture this Oil downtrend.
What’s that actually look like in real life – on this Crude Oil move. Well, we went back to the basics and created 9 different trend following models based on some rather universal logic for doing so to see just that. We used a Donchian breakout system which looks to enter a short trade at a new period low (ie. 20 day low), moving average cross over models which go short when the short term moving average crosses below the longer term average (i.e. 20 and 50 days), and a Bollinger Band breakout model which brackets prices two standard deviations above and below the mean, entering short on prices closing below the lower band.
We then ran all of the models on three different time frames: short (10 to 50 day look-back periods), medium (20 to 200 day periods), and long term (50 to 800 days) to see just what type of models were getting in and out at which prices and dates. What we found when plotting all of the different long exits and short entry points is that there are many ways to skin this cat, with the shorter term models understandably having identified the end of the long trend and beginning of the down trend sooner – entering short trades as early as October 18th (about $13 ago):
SHORT TERM

The medium terms models, interestingly, exited longs at roughly the same time as the short term ones. But took longer to get short, with most short by the beginning of November, entering around $63.
MEDIUM TERM

And finally, for those who have stretched the reaction time in their models to better weed out false breakouts and whipsaw moves, the longer term models took as much time to exit (on the whole) as the short and medium term models did to enter. And only one of the four long term models has gone short (Bollinger bands), despite Crude Oil’s 25% drop since the beginning of October.
LONG TERM 
Past performance is not indicative of future results. All data was gathered from bloomberg.com
The lesson – a 25% drop sure looks like a down trend to most of us, but depending on your particular brand of trend following – it may not have even registered as such yet. One man or women’s down trend is another’s up trend pullback, meaning it will take another leg down in this current Oil market to trigger full involvement on the downside form the systematic managed futures and macro folks.