This is what Non-CORNellation looks like

It’s been raining a lot here in the Midwest this spring. Like, only 5 little league games have actually been played instead of 15 scheduled, a lot. For most of us, that means some severe weather, tornado threats, and flooding.  But for those who plant the world’s Corn and Soybean crops in the Midwest, that means problems getting that crop in the ground. How bad? The USDA is reporting that the Corn crop is only about half as planted as it typically is for this time of year, with Corn about 58% planted versus 90% at this time last year. Here’s the state by state breakdown showing just how much Corn has been planted via Agweb.

And a big reason for that is because of this:

We touched on this planting issue as it related to the China trade war and tarrifs, but Corn in particular has been on a tear the past few weeks as fears of supply issues and the inability of farmers to get the crop planted has mounted. If you can’t get it planted, you can’t grow it, and you can’t harvest it – meaning there will be less Corn. Here’s the hourly chart showing Corn advancing by about 15% over the past month.

Now, you may be thinking who cares – they’ll just plant the Corn a little later and everything will work out OK. But as one of RCM’s AG specialists, Jody Lawrence, points out –  the farmers are running up against time here. One, you can’t just plant the Corn as late as you want, as it takes pretty much a set time to grow and the later you start, the later you’ll finish – meaning you’ll have potential frost issues and problems getting the crop out of the ground the later into the fall you go. Second, there are deadlines that have to be met in order for farmer’s to qualify for prevented-plant insurance -which pays out when farmers are unable to sow crops at all.  Here’s Jody:

Over the weekend we passed the first set of prevent plant dates for corn in the WCB on Saturday the 25th with another round this Friday the 31st and then the last date next Wednesday June 5th. With unfriendly forecasts into late next week and 42% of the forecast corn acres (39 MA) and 71% of the bean acres (61 MA) still needing to be planted and most soybean PP dates around June 15th, the outlook is not good. Growers have about a week to decide whether to plant their Corn or lose the ability to claim the insurance.

Who cares?
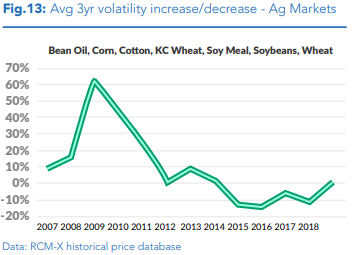
Well,  the farmers for one. And the grain companies and ethanol plants and anyone who needs to feed some livestock, secondly. But bringing it back to the alternative investment world – there’s a few 100 billion of dollars in Ag Trading CTAs and quant hedge funds which track things like Corn prices that have been waiting a long time for a move like this. We highlighted the lack of such volatility in the past few years in the Ag space in our 2019 managed futures outlook, and even predicted an increase in AG volatility being one of the potential drivers of managed futures and alternative investment performance in 2019.

It sure seems like we’re seeing an increase in volatility in the weather, which is one of the biggest price drivers of Ag prices. Record forest fires. Bigger and costlier hurricanes. Hotter and longer droughts, and so forth surely must cause… [some sort of reversal of] the declining volatility environment of the past several years.….it wouldn’t surprise us at all to see the smaller Ag markets awake out of their long slumber to add to the equation in 2019.

Which all leads us to commodities markets non-correlation with the stock market. Things like a freak blizzard causing an up trend in cattle prices, a swine virus breaking out in China, and record rains in the Midwest simply aren’t part of the stock, bond, interest rate world. Prices aren’t rising because of a good consumer confidence number, earnings report, or interest rate decision. Prices are rising because there are millions of acres of Corn yet to be planted and at threat of never getting planted (economics 101 = supply down, price up). In more sophisticated vernacular – the two markets have different price drivers, and the price driver for Corn is about as far away from the price drivers for the stock market as you can get.

2 comments

  1. […] Über den aktu­el­len Anstieg vom Mais-Preis (Eng­lisch, rcmal­ter­na­ti­ves) […]

  2. […] Commodities are down almost 9% (no surprise there since we’ve been talking about soybeans and corn for a while now) to round out the end of […]

Comments are closed.

Disclaimer
The performance data displayed herein is compiled from various sources, including BarclayHedge, and reports directly from the advisors. These performance figures should not be relied on independent of the individual advisor's disclosure document, which has important information regarding the method of calculation used, whether or not the performance includes proprietary results, and other important footnotes on the advisor's track record.

The programs listed here are a sub-set of the full list of programs able to be accessed by subscribing to the database and reflect programs we currently work with and/or are more familiar with.

Benchmark index performance is for the constituents of that index only, and does not represent the entire universe of possible investments within that asset class. And further, that there can be limitations and biases to indices such as survivorship, self reporting, and instant history. Individuals cannot invest in the index itself, and actual rates of return may be significantly different and more volatile than those of the index.

Managed futures accounts can subject to substantial charges for management and advisory fees. The numbers within this website include all such fees, but it may be necessary for those accounts that are subject to these charges to make substantial trading profits in the future to avoid depletion or exhaustion of their assets.

Investors interested in investing with a managed futures program (excepting those programs which are offered exclusively to qualified eligible persons as that term is defined by CFTC regulation 4.7) will be required to receive and sign off on a disclosure document in compliance with certain CFT rules The disclosure documents contains a complete description of the principal risk factors and each fee to be charged to your account by the CTA, as well as the composite performance of accounts under the CTA's management over at least the most recent five years. Investor interested in investing in any of the programs on this website are urged to carefully read these disclosure documents, including, but not limited to the performance information, before investing in any such programs.

Those investors who are qualified eligible persons as that term is defined by CFTC regulation 4.7 and interested in investing in a program exempt from having to provide a disclosure document and considered by the regulations to be sophisticated enough to understand the risks and be able to interpret the accuracy and completeness of any performance information on their own.

RCM receives a portion of the commodity brokerage commissions you pay in connection with your futures trading and/or a portion of the interest income (if any) earned on an account's assets. The listed manager may also pay RCM a portion of the fees they receive from accounts introduced to them by RCM.

Limitations on RCM Quintile + Star Rankings

The Quintile Rankings and RCM Star Rankings shown here are provided for informational purposes only. RCM does not guarantee the accuracy, timeliness or completeness of this information. The ranking methodology is proprietary and the results have not been audited or verified by an independent third party. Some CTAs may employ trading programs or strategies that are riskier than others. CTAs may manage customer accounts differently than their model results shown or make different trades in actual customer accounts versus their own accounts. Different CTAs are subject to different market conditions and risks that can significantly impact actual results. RCM and its affiliates receive compensation from some of the rated CTAs. Investors should perform their own due diligence before investing with any CTA. This ranking information should not be the sole basis for any investment decision.

See the full terms of use and risk disclaimer here.

logo